F & M Bank Corp. Announces Second Quarter 2022 Earnings And Dividend
TIMBERVILLE, VA / ACCESSWIRE / July 28, 2022 / F & M Bank Corp. (OTCQX:FMBM), parent company (the Company) of Farmers & Merchants Bank today reported earnings for quarter ending June 30, 2022.
Mark Hanna, President, commented “ F&M Bank had earnings of $1.8 million in the second quarter of 2022 which were driven by strong loan demand within our Shenandoah Valley Communities. Loans outstanding grew $32 million in the past quarter as we continue to build a solid pipeline of future opportunities. Given challenging economic and market conditions, we strive to maintain our disciplined approach to growth, pricing and underwriting. Our investment portfolio continues to contribute meaningfully to earnings and our deposits growth has leveled off with a slight decline during the quarter. While we did add $600 thousand to our provision for loan losses this quarter due to the loan growth and economic uncertainty, our core operating earnings are strong and growing. The strategic focus of developing our team, improving our infrastructure, and maintaining our asset quality while developing lasting relationships in our community continues to position F&M for future success.”
Selected financial highlights include:
- Net income of $1.8 million for the quarter ended June 30, 2022.
- Total deposit decreases of $12 million (1.09%), increases of $20.0 million (1.84%) and increases of $144.9 million (15.16%), respectively for the quarter, year to date and for the trailing twelve months.
- Loans held for investment increase of $32.3 million (4.92%), $35.3 million (5.40%) and $51.6 million (8.08%), respectively for the quarter, year to date and for the trailing twelve months (excluding PPP loans).
- Nonperforming loans as a percent of total assets decreased to .15% from .45% at year end and .50% on June 30, 2021.
- Provision for loan losses of $600 thousand for the quarter and $150 thousand year to date.
- Allowance for loan losses of 1.12% of loans held for investment, excluding PPP.
BALANCE SHEET
Loans
Loans held for investment; net of PPP have grown 8.08% since June 30, 2021, and 9.97% since December 31, 2021. The Agriculture, C&I, CRE and dealer portfolios have experienced growth throughout the quarter and year to date, while the Company has seen a reduction in consumer loans specifically in the 1-4 family residential loan area.
|
(dollars in thousands)
|
6/30/2022 | 12/31/2021 | Change | 6/30/2021 | Change | |||||||||||||||
|
Commercial
|
$ | 311,126 | $ | 286,500 | $ | 24,626 | $ | 277,475 | $ | 33,651 | ||||||||||
|
Agriculture
|
91,269 | 81,879 | 9,390 | 74,205 | 17,064 | |||||||||||||||
|
Dealer
|
119,758 | 107,346 | 12,412 | 101,435 | 18,323 | |||||||||||||||
|
Consumer
|
164,771 | 173,556 | (8,785 | ) | 179,993 | (15,222 | ) | |||||||||||||
|
Other
|
2,901 | 5,205 | (2,304 | ) | 5,119 | (2,218 | ) | |||||||||||||
|
Loans held for Investment, net of PPP
|
$ | 689,825 | $ | 654,486 | $ | 35,339 | $ | 638,227 | $ | 51,598 | ||||||||||
Investments
The Company has continued to leverage excess funds into the available for sale (AFS) investment portfolio in the second quarter of 2022. Since the beginning of the year, the investment portfolio has gown $42.9 million to $447 million. The portfolio is a strong mix of U.S. Treasuries, Agencies, Mortgaged-backed securities, Municipals, and corporate bonds. The average tax equivalent yield on the portfolio is 1.67% which has equated to $2.0 million in income compared to $536 thousand in the same period last year.
AFS INVESTMENT PORTFOLIO
|
($000s)
|
6/30/22 | 12/31/21 | Change | 6/30/21 | Change | |||||||||||||||
|
US Treasury
|
$ | 46,737 | $ | 29,482 | $ | 17,255 | $ | 29,406 | $ | 17,331 | ||||||||||
|
Agency
|
156,148 | 133,714 | $ | 22,434 | 24,735 | $ | 131,413 | |||||||||||||
|
Mortgage Backed Securities
|
171,031 | 183,647 | $ | (12,616 | ) | 91,426 | $ | 79,605 | ||||||||||||
|
Municipals
|
43,686 | 34,337 | $ | 9,349 | 29,332 | $ | 14,354 | |||||||||||||
|
Corporates
|
29,221 | 22,702 | $ | 6,519 | 13,755 | $ | 15,466 | |||||||||||||
|
Total Securities
|
$ | 446,823 | $ | 403,882 | $ | 42,941 | $ | 188,654 | $ | 258,169 | ||||||||||
|
Securities Quarterly Income
|
$ | 1,970 | $ | 1,102 | $ | 868 | $ | 536 | $ | 1,434 | ||||||||||
Deposits
During the second quarter of 2022, the Company experienced a slight decline in deposits. However, growth for the year is 1.84%. The Company continues to strategically focus on building primary banking relationships which is reflected in the $11 million growth in noninterest bearing accounts.
DEPOSIT PORFOLIO
|
(dollars in thousands)
|
6/30/22 | 12/31/21 | Change | 6/30/21 | Change | |||||||||||||||
|
Non Interest. Bearing
|
$ | 291,728 | $ | 280,993 | $ | 10,735 | $ | 269,618 | $ | 22,110 | ||||||||||
|
NOW & Other Transactional
|
193,037 | 191,969 | 1,068 | 150,323 | 42,714 | |||||||||||||||
|
Money market and Savings
|
500,108 | 483,476 | 16,632 | 403,714 | 96,394 | |||||||||||||||
|
Certificates of deposit
|
115,337 | 123,857 | (8,520 | ) | 131,689 | (16,352 | ) | |||||||||||||
|
Total Deposits
|
$ | 1,100,210 | $ | 1,080,295 | $ | 19,915 | $ | 955,344 | $ | 144,866 | ||||||||||
| 1.84 | 15.16 | |||||||||||||||||||
Asset Quality
Nonperforming loans as a percent of total assets (net of PPP) continue to decline from 0.50% on June 30, 2021, to 0.15% on June 30, 2022. Classified loans declined from the previous twelve months from 9.14% to 6.82%, respectively (net of PPP). The Company did experience a slight increase in delinquencies from 0.37% on June 30, 2021, to 0.59% at June 30, 2022 with the majority of the increase in the 30-59 days.
|
(000’s)
|
6/30/2022 | 12/31/2021 | 6/30/2021 | |||||||||
|
Non-performing Loans
|
||||||||||||
|
Non-accrual loans
|
$ | 1,851 | $ | 5,465 | $ | 5,532 | ||||||
|
Over 90 & on Accrual
|
55 | 43 | – | |||||||||
|
Total Non-performing Loans
|
$ | 1,906 | $ | 5,508 | $ | 5,532 | ||||||
|
NPL As A % of Total Assets, net of PPP
|
0.15 | % | 0.45 | % | 0.50 | % | ||||||
|
Watch Total
|
$ | 31,663 | $ | 24,140 | $ | 36,406 | ||||||
|
As A % Of Loans, net of PPP
|
4.56 | % | 3.67 | % | 5.65 | % | ||||||
|
Substandard Total
|
$ | 15,738 | $ | 19,713 | $ | 22,423 | ||||||
|
As A % Of Loans, net of PPP
|
2.27 | % | 2.99 | % | 3.48 | % | ||||||
|
Total Watch List
|
$ | 47,401 | $ | 43,853 | $ | 58,829 | ||||||
|
Total Classified As A % of Total Loans, net of PPP
|
6.82 | % | 6.66 | % | 9.14 | % | ||||||
|
Past Due Loans
|
||||||||||||
|
30-59 Days Past Due
|
$ | 3,304 | $ | 2,751 | $ | 1,640 | ||||||
|
60-89 Days Past Due
|
762 | 432 | 716 | |||||||||
|
90+ Days Past Due
|
41 | 43 | – | |||||||||
|
Total Past Due Loans
|
$ | 4,107 | $ | 3,226 | $ | 2,356 | ||||||
|
Deliquency %, net of PPP
|
0.59 | % | 0.49 | % | 0.37 | % | ||||||
|
Performing TDRs
|
||||||||||||
|
Real estate
|
1,914 | 1,930 | 2,547 | |||||||||
|
Commercial
|
2,082 | 2,826 | 2,167 | |||||||||
|
HE
|
– | 148 | 669 | |||||||||
|
Other
|
86 | 95 | 831 | |||||||||
Allowance for Loan and Lease Losses
The allowance for loan losses as a percentage of loans held for investment, net of PPP has declined from 1.35% on June 30, 2021, to 1.12% on June 30, 2022. This decline has been driven by improved asset quality as evidenced by the decline in nonperforming assets and classified loans. Uncertainty in the economy related to the war in Ukraine, inflation, supply chain issues, increase in past due loans, growth in the portfolio over the trailing twelve months and the increase in interest rates were all factored in the allowance for loan loss calculation resulting in a provision for loan losses of $600 for the quarter and $150 for the year.
| Three months ended | Six months ended | |||||||||||||||||||
| 6/30/2022 | 3/31/2022 | 6/30/2021 | 6/30/2022 | 6/30/2021 | ||||||||||||||||
|
(000’s)
|
||||||||||||||||||||
|
Provision for Loan Losses
|
$ | 600 | $ | (450 | ) | $ | (1,250 | ) | $ | 150 | $ | (1,975 | ) | |||||||
|
Allowance for Loan and Leases Losses
|
$ | 7,798 | $ | 7,389 | $ | 8,705 | $ | 7,798 | $ | 8,705 | ||||||||||
|
ALLL as a % of Loans Held for Investment, net of PPP
|
1.12 | % | 1.12 | % | 1.35 | % | 1.12 | % | 1.35 | % | ||||||||||
INCOME STATEMENT
Net Interest Income
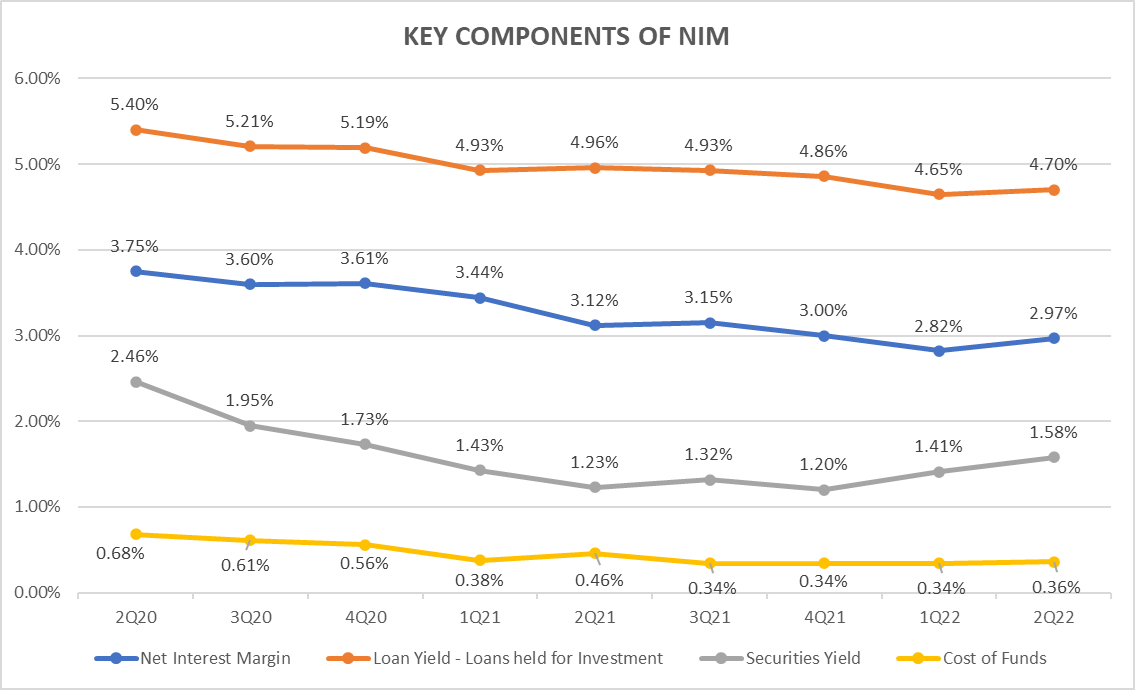
Quarterly net interest income reflects growth of $1 million over first quarter and $1.3 million over June 30, 2021. This growth is attributed to the income produced by the investment portfolio that has continued to grow in the second quarter of 2022, increases in variable rate loan rates, growth in the loan portfolio and the lower cost of funds.
Margin compression has reduced the net interest margin from 3.12% on June 30, 2021, to 2.97% on June 30, 2022, however for the second consecutive quarter net interest margin increased from the December 31, 2021, margin of 2.82%. We are seeing the results of the Company’s efforts to mitigate compression by continuing to invest excess funds into securities with better yields and growth in the loan portfolio. The Company has also slightly reduced cost of funds since June 30, 2021, to 36 basis points through maintaining deposit rates and growth in noninterest bearing deposits.
Noninterest Income
Noninterest income of $2.4 million for the quarter is slightly lower than first quarter ($2.5 million) and a decline from June 30, 2021, which was $3.0 million. Mortgage originations have declined as rates have increased. As a result, the Company is focused on expanding mortgage originators into our newer markets and offering variable rate products to our mortgage customers. The Company is also continuing to utilize our title company and growing our wealth management division.
Noninterest expense
Focusing on infrastructure enhancements, developing our team and expanding into our newer markets has resulted in growth in noninterest expense of 3.6% in the trailing twelve months.
Paycheck Protection Program
The Company processed 1,080 Paycheck Protection Program (“PPP”) & CARES Act loans during 2020 and 2021 totaling $87.1 million. Fees associated with these loans are amortized over the life of the loan or recognized fully when repaid or forgiven. The Company holds $671 thousand in PPP loans as of June 30, 2022, and recognized $54 thousand in PPP fee income in the second quarter.
Dividends Declaration
On July 21, 2022, our Board of Directors declared a second quarter dividend of $.26 per share to common shareholders. Based on our most recent trade price of $25.48 per share this constitutes a 4.08% yield on an annualized basis. The dividend will be paid on August 29, 2022, to shareholders of record as of August 14, 2022.”
F & M Bank Corp. is an independent, locally owned, financial holding company, offering a full range of financial services, through its subsidiary, Farmers & Merchants Bank’s thirteen banking offices in Rockingham, Shenandoah, and Augusta Counties, Virginia and the city of Winchester, VA. The Bank also provides additional services through a loan production office located in Penn Laird, VA, a loan production office in Winchester, VA and through its subsidiaries, F&M Mortgage and VSTitle, both of which are located in Harrisonburg, VA. Additional information may be found by contacting us on the internet at www.fmbankva.com or by calling (540) 896-1705.
F & M Bank Corp.
Key Statistics
| 2022 | 2021 | |||||||||||||||||||||||
| Q2 | Q1 | YTD | Q2 | Q1 | YTD | |||||||||||||||||||
|
Net Income (000’s)
|
$ | 1,789 | $ | 2,528 | $ | 4,317 | $ | 3,220 | $ | 3,801 | $ | 7,021 | ||||||||||||
|
Net Income available to Common
|
$ | 1,789 | $ | 2,528 | $ | 4,317 | $ | 3,154 | $ | 3,736 | $ | 6,890 | ||||||||||||
|
Earnings per common share – basic
|
$ | 0.51 | $ | 0.74 | $ | 1.25 | $ | 0.98 | $ | 1.17 | $ | 2.15 | ||||||||||||
|
Earnings per common share – diluted
|
$ | – | $ | – | $ | – | $ | 0.93 | $ | 1.11 | $ | 2.04 | ||||||||||||
|
Return on Average Assets
|
0.58 | % | 0.83 | % | 0.76 | % | 1.22 | % | 1.56 | % | 1.39 | % | ||||||||||||
|
Return on Average Equity
|
8.97 | % | 10.88 | % | 8.92 | % | 13.06 | % | 15.96 | % | 14.78 | % | ||||||||||||
|
Dividend Payout Ratio
|
50.98 | % | 35.14 | % | 41.60 | % | 26.53 | % | 22.22 | % | 24.19 | % | ||||||||||||
|
Net Interest Margin
|
3.15 | % | 2.82 | % | 2.97 | % | 3.13 | % | 3.44 | % | 3.27 | % | ||||||||||||
|
Yield on Average Earning Assets
|
3.50 | % | 3.17 | % | 3.32 | % | 3.56 | % | 3.92 | % | 3.72 | % | ||||||||||||
|
Yield on Average Interest Bearing Liabilities
|
0.48 | % | 0.49 | % | 0.49 | % | 0.62 | % | 0.70 | % | 0.66 | % | ||||||||||||
|
Net Interest Spread
|
3.02 | % | 2.68 | % | 2.83 | % | 2.94 | % | 3.22 | % | 3.06 | % | ||||||||||||
|
Provision for Loan Losses (000’s)
|
$ | 600 | $ | (450 | ) | $ | 150 | $ | (1,250 | ) | $ | (725 | ) | $ | (1,975 | ) | ||||||||
|
Net Charge-offs
|
$ | 192 | $ | (92 | ) | $ | 100 | $ | (272 | ) | $ | 45 | $ | (227 | ) | |||||||||
|
Net Charge-offs as a % of Loans
|
0.03 | % | -0.01 | % | 0.02 | % | -0.16 | % | 0.03 | % | -0.03 | % | ||||||||||||
|
Non-Performing Loans (000’s)
|
$ | 1,906 | $ | 4,799 | $ | 1,906 | $ | 5,532 | $ | 5,783 | $ | 5,532 | ||||||||||||
|
Non-Performing Loans to Total Assets
|
0.15 | % | 0.39 | % | 0.15 | % | 0.50 | % | 0.57 | % | 0.50 | % | ||||||||||||
|
Non-Performing Assets (000’s)
|
$ | 2,103 | $ | 4,799 | $ | 2,103 | $ | 5,532 | $ | 5,783 | $ | 5,532 | ||||||||||||
|
Non-Performing Assets to Assets
|
0.17 | % | 0.39 | % | 0.17 | % | 0.50 | % | 0.57 | % | 0.50 | % | ||||||||||||
|
Efficiency Ratio
|
75.73 | % | 78.68 | % | 77.14 | % | 76.07 | % | 68.00 | % | 72.00 | % | ||||||||||||
- The net interest margin is calculated by dividing tax equivalent net interest income by total average earning assets. Tax equivalent interest income is calculated by grossing up interest income for the amounts that are nontaxable (i.e. municipal securities and loan income) then subtracting interest expense. The tax rate utilized is 21%. The Company’s net interest margin is a common measure used by the financial service industry to determine how profitable earning assets are funded. Because the Company earns nontaxable interest income from municipal loans and securities, net interest income for the ratio is calculated on a tax equivalent basis as described above.
- The efficiency ratio is not a measurement under accounting principles generally accepted in the United States. The efficiency ratio is a common measure used by the financial service industry to determine operating efficiency. It is calculated by dividing non-interest expense by the sum of tax equivalent net interest income and non-interest income excluding gains and losses on the investments portfolio and Other Real Estate Owned. The Company calculates this ratio in order to evaluate how efficiently it utilizes its operating structure to create income. An increase in the ratio from period to period indicates the Company is losing a greater percentage of its income to expenses.
This press release may contain “forward-looking statements” as defined by federal securities laws, which may involve significant risks and uncertainties. These statements address issues that involve risks, uncertainties, estimates and assumptions made by management, and actual results could differ materially from the results contemplated by these forward-looking statements. Factors that could have a material adverse effect on our operations and future prospects include, but are not limited to, changes in interest rates, general economic conditions, legislative and regulatory policies, and a variety of other matters. Other risk factors are detailed from time to time in our Securities and Exchange Commission filings. Readers should consider these risks and uncertainties in evaluating forward-looking statements and should not place undue reliance on such statements. We undertake no obligation to update these statements following the date of this press release.
Income Statement
| Three months ended | Six months ended | |||||||||||||||||||
| 6/30/2022 Unaudited | 3/31/2022 Audited | 6/30/2021 Audited | 6/30/2022 Unaudited | 6/30/2021 Unaudited | ||||||||||||||||
|
(dollars in thousands)
|
||||||||||||||||||||
|
Interest and Dividend Income
|
$ | 10,009 | $ | 9,061 | $ | 8,819 | $ | 19,070 | $ | 17,566 | ||||||||||
|
Interest Expense
|
1,008 | 1,004 | 1,069 | 2,012 | 2,137 | |||||||||||||||
|
Net Interest Income
|
9,001 | 8,057 | 7,750 | 17,058 | 15,429 | |||||||||||||||
|
Non-Interest Income
|
2,368 | 2,483 | 3,086 | 4,851 | 6,441 | |||||||||||||||
|
Provision for Loan Losses
|
600 | (450 | ) | (1,250 | ) | 150 | (1,975 | ) | ||||||||||||
|
Loss on sale of securities
|
97 | – | – | 97 | – | |||||||||||||||
|
Impairment of long-lived assets
|
– | – | – | – | – | |||||||||||||||
|
Other Non-Interest Expenses
|
8,752 | 8,550 | 8,444 | 17,302 | 16,130 | |||||||||||||||
|
Income Before Income Taxes
|
1,920 | 2,440 | 3,642 | 4,360 | 7,715 | |||||||||||||||
|
Provision for Income Taxes
|
131 | (88 | ) | 422 | 43 | 693 | ||||||||||||||
|
Net Income
|
$ | 1,789 | $ | 2,528 | $ | 3,220 | $ | 4,317 | $ | 7,022 | ||||||||||
|
Dividend on preferred stock
|
– | – | 66 | – | 66 | |||||||||||||||
|
Net Income available to common shareholders
|
$ | 1,789 | $ | 2,528 | $ | 3,154 | $ | 4,317 | $ | 6,956 | ||||||||||
|
Average Common Shares Outstanding
|
3,452,711 | 3,434,892 | 3,207,978 | 3,443,850 | 3,206,534 | |||||||||||||||
|
Net Income Per Common Share
|
$ | 0.51 | $ | 0.74 | 0.98 | $ | 1.25 | $ | 2.15 | |||||||||||
|
Dividends Declared
|
$ | 0.26 | $ | 0.26 | $ | 0.26 | $ | 0.26 | $ | 0.26 | ||||||||||
Balance Sheet
| 6/30/2022 Unaudited | 12/31/2021 Audited | Change | 6/30/2021 Unaudited | Change | ||||||||||||||||
|
(dollars in thousands)
|
||||||||||||||||||||
|
Cash and Due from Banks
|
$ | 13,636 | $ | 8,579 | $ | 5,057 | $ | 15,415 | $ | (1,779 | ) | |||||||||
|
Interest Bearing Bank Deposits
|
187 | 2,875 | $ | (2,688 | ) | 3,901 | $ | (3,714 | ) | |||||||||||
|
Federal Funds Sold
|
3,430 | 76,667 | $ | (73,237 | ) | 166,698 | $ | (163,268 | ) | |||||||||||
|
Loans Held for Sale
|
5,448 | 4,887 | $ | 561 | 8,855 | $ | (3,407 | ) | ||||||||||||
|
Loans Held for Investment
|
690,497 | 662,422 | $ | 28,075 | 660,956 | $ | 29,541 | |||||||||||||
|
Less Allowance for Loan Losses
|
(7,798 | ) | (7,748 | ) | $ | (50 | ) | (8,727 | ) | $ | 929 | |||||||||
|
Net Loans Held for Investment
|
682,699 | 654,674 | $ | 28,025 | 652,229 | $ | 30,470 | |||||||||||||
|
Securities
|
456,635 | 413,217 | $ | 43,418 | 198,814 | $ | 257,821 | |||||||||||||
|
Other Assets
|
59,517 | 58,443 | $ | 1,074 | 59,063 | $ | 454 | |||||||||||||
|
Total Assets
|
$ | 1,221,552 | $ | 1,219,342 | $ | 2,210 | $ | 1,104,975 | $ | 116,577 | ||||||||||
|
Deposits
|
1,100,210 | 1,080,295 | $ | 19,915 | 955,344 | $ | 144,866 | |||||||||||||
|
Long Term Debt
|
11,788 | 21,772 | $ | (9,984 | ) | 31,310 | $ | (19,522 | ) | |||||||||||
|
Other Liabilities
|
47,604 | 16,819 | $ | 30,785 | 18,109 | $ | 29,495 | |||||||||||||
|
Total Liabilities
|
1,159,602 | 1,118,886 | $ | 40,716 | 1,004,763 | $ | 154,839 | |||||||||||||
|
Preferred Stock
|
– | – | $ | – | 4,558 | $ | (4,558 | ) | ||||||||||||
|
Common Equity
|
71,950 | 100,456 | $ | (28,506 | ) | 95,654 | $ | (23,704 | ) | |||||||||||
|
Stockholders’ Equity
|
71,950 | 100,456 | $ | (28,506 | ) | 100,212 | $ | (28,262 | ) | |||||||||||
|
Total Liabilities and Stockholders’ Equity
|
$ | 1,231,552 | $ | 1,219,342 | $ | 12,210 | $ | 1,104,975 | $ | 126,577 | ||||||||||
|
Book Value Per Common Share
|
$ | 21.01 | $ | 29.42 | $ | 29.80 | ||||||||||||||
|
Tangible Book Value Per Common Share
|
$ | 20.06 | $ | 28.47 | $ | 29.98 | ||||||||||||||
CONTACT:
Carrie Comer EVP/Chief Financial Officer
540-896-1705 or ccomer@fmbankva.com
SOURCE: F & M Bank Corp.
View source version on accesswire.com:
https://www.accesswire.com/710009/F-M-Bank-Corp-Announces-Second-Quarter-2022-Earnings-And-Dividend