Millennials: How Much Are You Really Spending?
You might share certain spending habits with other millennials — and you might occasionally catch flak for those habits. But some of these patterns are a byproduct of your age and the times we live in: spending less on health care because younger adults are generally healthier, for example, or spending less on magazines and records and more on e-books and streaming music. And if you compare how much of your income you’re spending on, say, entertainment, with what other generations are spending, you might be surprised by how small the differences are.
You might share certain spending habits with other millennials — and you might occasionally catch flak for those habits. But some of these patterns are a byproduct of your age and the times we live in: spending less on health care because younger adults are generally healthier, for example, or spending less on magazines and records and more on e-books and streaming music. And if you compare how much of your income you’re spending on, say, entertainment, with what other generations are spending, you might be surprised by how small the differences are.
By looking at annual spending across generations in the Bureau of Labor Statistics’ Consumer Expenditure Survey, you’ll see how age groups spend differently according to their needs and priorities — and get an idea of how your own priorities and payouts measure up.
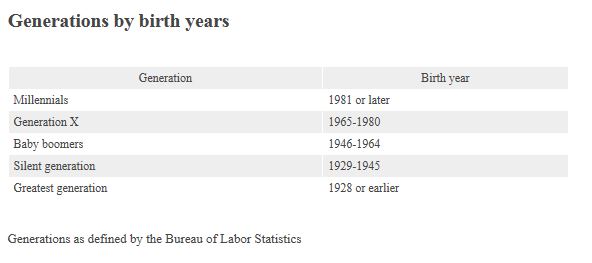
The Consumer Expenditure Survey measures all annual expenditures, such as housing, health care, food, entertainment, insurance, education, utilities, clothing and transportation.
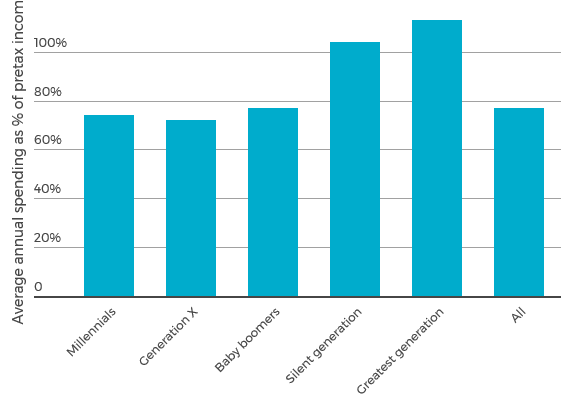
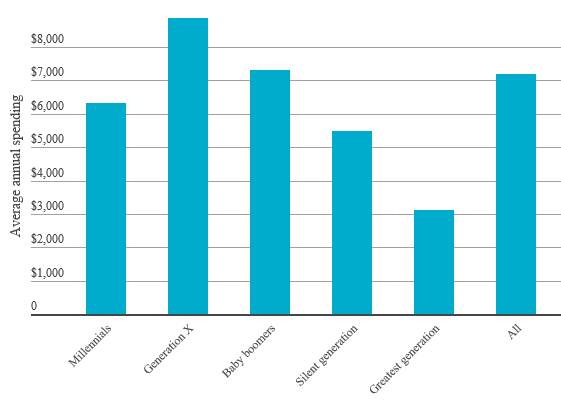
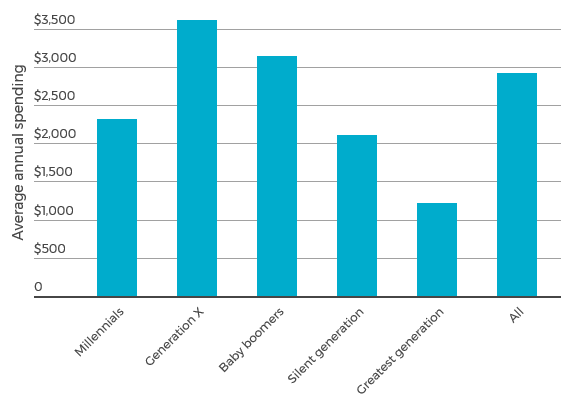
Total annual spending: How do you compare?
$48,576: Average amount millennials spent in 2016
The oldest two generations spent far more of their income last year, but they also earn far less than other groups. The average pretax income for millennials was $65,373.
Food
You might enjoy going out for dinner — but so does everyone else — and your overall food spending is well-aligned with nearby generations. Millennials spent an average of $6,316, or 10% of their pretax income, on food in 2016. Members of Generation X spent the highest dollar amount in this category — $8,870 — but it accounted for a similar percentage (9%) of their income.
Food spending: How do you compare?
$6,316: Average amount millennials spent on food in 2016
Millennials spent 47% of their food budgets on food away from home, more than all other groups. Still, their total food spending as a percentage of income (10%) was equal to the average across all generations.
Fun fact: Millennials spent less than any other generation on ice cream last year: $40.34, on average.
Alcohol
By some measures, you might have spent more than members of other generations on drinking away from home last year — 53% of your alcohol budget if you’re average, according to the data. But all generations spent approximately 1% of their income on alcohol.
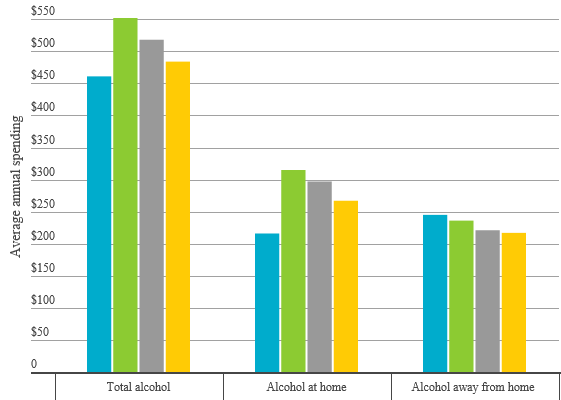
Alcohol spending: How do you compare?
$461: Average amount millennials spent on alcohol in 2016
All generations spent approximately 1% of their income on alcohol. However, millennials spent the greatest portion of their alcohol budget (53%) and the most money overall on booze away from home.

Shelter
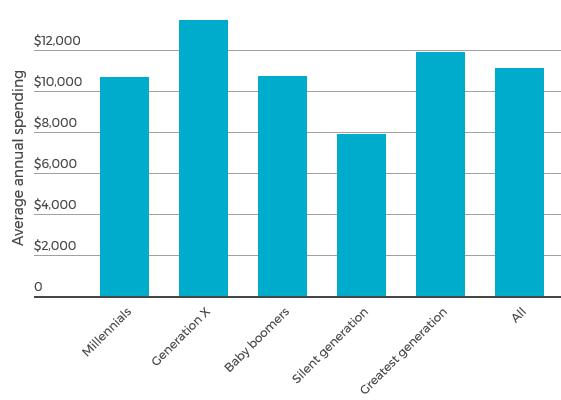
If you’re like most of your peers, you spent relatively little on shelter in 2016 — second only to the silent generation, who might live in mortgage-free homes or with other family members. Shelter spending includes many of the costs of keeping a roof over your head: rent or costs to own, maintenance and repairs, and homeowners or renters insurance, for example.
Shelter spending: How do you compare?
$10,678: Average amount millennials spent on shelter costs in 2016
Millennials spent fewer dollars, on average, than Generation X and baby boomers, but shelter costs accounted for 16% of their pretax income. Generation X spent 14% of their income on shelter, and baby boomers spent 13%.
Utilities
Nearly everyone spent less on residential phone service than cellular phone service in 2016, and you’re among the generation that spent the least. Millennials, Generation Xers, and baby boomers all spent an average of about 5% of their annual income on utility costs. Considering you’re likely to have a lower income than an older adult, you might be doing some strategic budgeting to keep those bills under control.
Utility spending: How do you compare?
$3,020: Average amount millennials spent on all utilities in 2016
Millennials, Generation X and baby boomers spent an average of 5% of their annual salary on utilities last year.
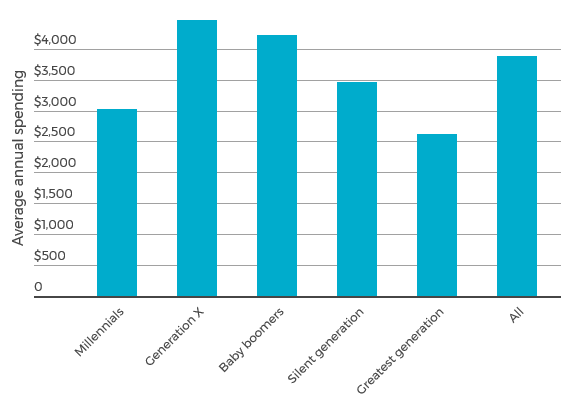
Not all utilities measured in the Consumer Expenditure Survey are portrayed in this chart.
Clothing
Your generation might get a bad rap for frivolous spending, but you probably spent less than many older adults on clothing in 2016. Members of Generation X spent far more — $2,577, on average — but Gen Xers and millennials both spent 3% of their pretax income on apparel and related services.
Clothing spending: How do you compare?
$1,753: Average amount millennials spent on apparel and related services in 2016
All groups spent an average of between 2% and 3% of their total income on apparel. Compare total spending across generations in the second tab below.
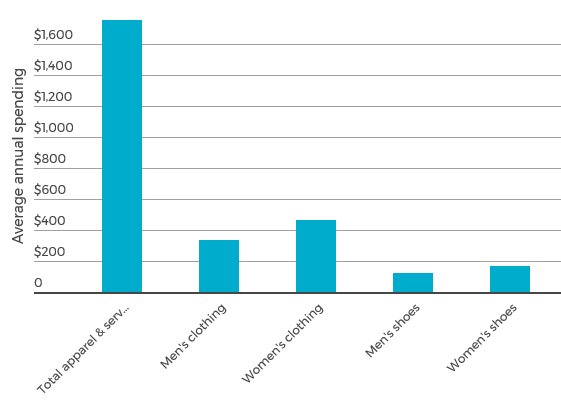
Not all apparel and services expenses within the Consumer Expenditure Survey are illustrated in this chart.
Transportation
If 2016 expenditures are an indication, you’re more likely to buy a used vehicle than new. And you probably spent more on public transportation — including buses, taxis, subways and commuter rails — than members of older generations.
Because millennials are slightly less likely to own vehicles than other generations, the data on vehicle purchases, gas and related car-ownership expenses are slightly skewed by those who answered $0 to those questions.
Transportation spending: How do you compare?
$8,426: Average amount millennials spent on all transportation costs in 2016
These costs accounted for 13% of millennials’ income, on average, while Generation X spent 11% and baby boomers spent 12%. Compare total transportation expenditures across all generations in the second tab below.
![]()
![]()
Not all transportation expenses included within the Consumer Expenditure Survey are displayed in this chart.
Fun fact: Millennials spent more on new motorcycles than any other generation ($64.65, on average), and spent far more on new motorcycles than used ($13.92, on average).
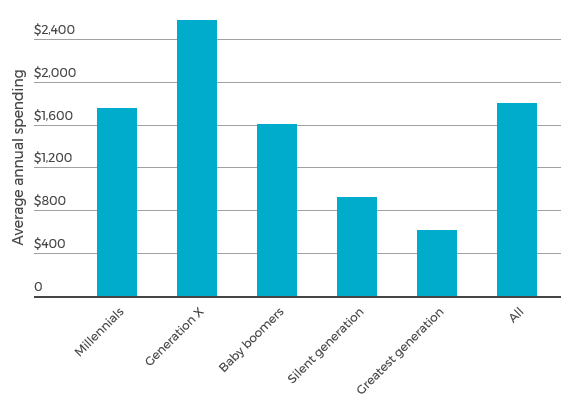
Entertainment
You might have spent less than members of some older generations on entertainment. Still, you likely spent more on streaming audio and video, and television probably took the biggest chunk out of your entertainment budget, with home internet services a close second.
Entertainment spending: How do you compare?
$2,311: Average amount millennials spent on all entertainment costs in 2016
All but the silent generation, who spent 5%, spent an average of about 4% of their income on entertainment. See how total entertainment spending compared across age groups in the second tab below.
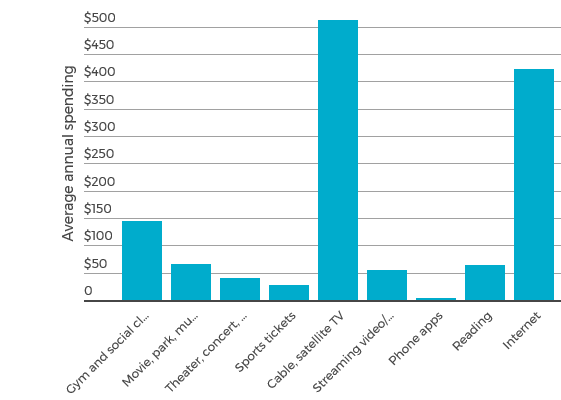
Not all entertainment expenses included within the Consumer Expenditure Survey are displayed in this chart.
Fun fact: Millennials spent more on musical instruments than any other generation: $25.04, on average.
Notes on the data
The data are from the Consumer Expenditure Survey, released Aug. 29, 2017. It’s based on questions the Bureau of Labor Statistics asks households across the U.S. about their spending habits throughout each year. When numerous people answer $0 for any single expense on the Consumer Expenditure Survey, the data are skewed and the average amount spent seems low. For example, few millennials pay for a home landline. So, in 2016, the average amount millennials spent on residential phone service was $90, or approximately $7.50 per month, far lower than most residential phone bills. There are similar patterns in vehicle and home ownership costs among millennials, as well as throughout the survey data.
The survey is asked of “consumer units,” not individuals. This means, in most cases, that the expenses are attributed to a single person in the household. So, for instance, if a 19-year-old millennial lives at home with his 45-year-old father, the household expenditures will appear under the father, or in the Generation X category of the generational tables.
© Copyright 2017 NerdWallet Inc. All Rights Reserved
YToxOntzOjE3OiJ0cmlnZ2VyX3JldmlzaW9ucyI7czoxOiIxIjt9