Handling Market Volatility

Conventional wisdom says that what goes up must come down. But even if you view market volatility as a normal occurrence, it can be tough to handle when your money is at stake. Though there’s no foolproof way to handle the ups and downs of the stock market, the following common-sense tips can help.


Don’t put your eggs all in one basket

Diversifying your investment portfolio is one of the key tools for trying to manage market volatility. Because asset classes often perform differently under different market conditions, spreading your assets across a variety of investments such as stocks, bonds, and cash alternatives has the potential to help reduce your overall risk. Ideally, a decline in one type of asset will be balanced out by a gain in another, though diversification can’t eliminate the possibility of market loss.

One way to diversify your portfolio is through asset allocation. Asset allocation involves identifying the asset classes that are appropriate for you and allocating a certain percentage of your investment dollars to each class (e.g., 70% to stocks, 20% to bonds, 10% to cash alternatives). A worksheet or an interactive tool may suggest a model or sample allocation based on your investment objectives, risk tolerance level, and investment time horizon, but that shouldn’t be a substitute for expert advice.


Focus on the forest, not on the trees

focus on forest

As the market goes up and down, it’s easy to become too focused on day-to-day returns. Instead, keep your eyes on your long-term investing goals and your overall portfolio. Although only you can decide how much investment risk you can handle if you still have years to invest, don’t overestimate the effect of short-term price fluctuations on your portfolio.


Look before you leap

When the market goes down and investment losses pile up, you may be tempted to pull out of the stock market altogether and look for less volatile investments. The modest returns that typically accompany low-risk investments may seem attractive when more risky investments are posting negative returns.

But before you leap into a different investment strategy, make sure you’re doing it for the right reasons. How you choose to invest your money should be consistent with your goals and time horizon.

For instance, putting a larger percentage of your investment dollars into vehicles that offer asset preservation and liquidity (the opportunity to easily access your funds) may be the right strategy for you if your investment goals are short term and you’ll need the money soon, or if you’re growing close to reaching a long-term goal such as retirement. But if you still have years to invest, keep in mind that stocks have historically outperformed stable-value investments over time, although past performance is no guarantee of future results. If you move most or all of your investment dollars into conservative investments, you’ve not only locked in any losses you might have, but you’ve also sacrificed the potential for higher returns. Investments seeking to achieve higher rates of return also involve a higher degree of risk.


 Look for the silver lining

Opportunity to buy shares

A down market, like every cloud, has a silver lining. The silver lining of a down market is the opportunity to buy shares of stock at lower prices. One of the ways you can do this is by using dollar-cost averaging. With dollar-cost averaging, you don’t try to “time the market” by buying shares at the moment when the price is lowest. In fact, you don’t worry about price at all. Instead, you invest a specific amount of money at regular intervals over time. When the price is higher, your investment dollars buy fewer shares of an investment, but when the price is lower, the same dollar amount will buy you more shares. A workplace savings plan, such as a 401(k) plan in which the same amount is deducted from each paycheck and invested through the plan, is one of the most well-known examples of dollar-cost averaging in action.


For example, let’s say that you decided to invest $300 each month. As the illustration shows, your regular monthly investment of $300 bought more shares when the price was low and fewer shares when the price was high:


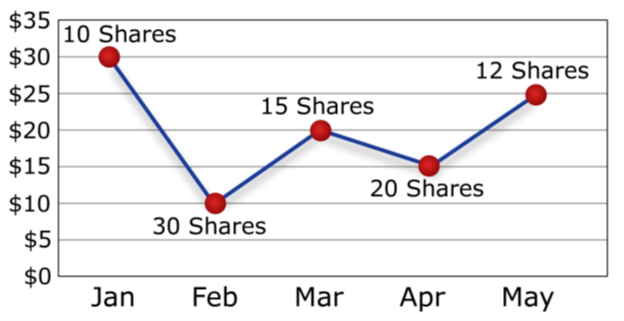
Although dollar-cost averaging can’t guarantee you a profit or avoid a loss, a regular fixed dollar investment may result in a lower average price per share over time, assuming you continue to invest through all types of market conditions.

(This hypothetical example is for illustrative purposes only and does not represent the performance of any particular investment. Actual results will vary.)


Making dollar-cost averaging work for you

  • Get started as soon as possible. The longer you have to ride out the ups and downs of the market, the more opportunity you have to build a sizable investment account over time.
  • Stick with it. Dollar-cost averaging is a long-term investment strategy. Make sure you have the financial resources and the discipline to invest continuously through all types of market conditions, regardless of price fluctuations.
  • Take advantage of automatic deductions. Having your investment contributions deducted and invested automatically makes the process easy and convenient.


Don’t stick your head in the sand

check portfolio at least once a year

While focusing too much on short-term gains or losses is unwise, so is ignoring your investments. You should check your portfolio at least once a year —more frequently if the market is particularly volatile or when there have been significant changes in your life.

You may need to rebalance your portfolio to bring it back in line with your investment goals and risk tolerance. Rebalancing involves selling some investments in order to buy others. Investors should keep in mind that selling investments could result in a tax liability. Don’t hesitate to get expert help if you need it to decide which investment options are right for you.


Don’t count your chickens before they hatch

balance between risk and return

As the market recovers from a down cycle, elation quickly sets in. If the upswing lasts long enough, it’s easy to believe that investing in the stock market is a sure thing. But, of course, it never is. As many investors have learned the hard way, becoming overly optimistic about investing during the good times can be as detrimental as worrying too much during the bad times. The right approach in all kinds of markets is to be realistic. Have a plan, stick with it, and strike a comfortable balance between risk and return.


Contact us today for an assessment.


Calan Jansen

Vice President at F&M Bank
Osaic Institutions Financial Advisor with F&M Financial Services, Inc.


Prepared by Broadridge Investor Communications Solutions, Inc.

Investment and insurance products and services are offered through Osaic Institutions, Inc., Member FINRA/SIPC. F&M Financial Services is a trade name of F&M Bank. Osaic Institutions and F&M Bank are not affiliated.

Securities and Insurance Products:

Not Guaranteed by the Bank | Not FDIC Insured | Not a Deposit | Not Insured by Any Federal Government Agency | May Lose Value Including Loss of Principal

F&M Bank Corp Announces First Quarter 2022 Earnings

F & M Bank Corp. News and Financials

TIMBERVILLE, VA—April 25, 2022—F & M Bank Corp. (OTCQX: FMBM), parent company (the Company) of Farmers & Merchants Bank today reported net income of $2.5 million for quarter ending March 31, 2022.

Mark Hanna, President, commented “First quarter of 2022 has been a strong quarter for F&M bank with net income of $2.5 million. Deposits grew this quarter another 2.96% and have been deployed into $3 million of net loan growth, excluding PPP and $58 million of new investments in bonds to capitalize on the rising rate environment.   We continue to focus strategically on improving our infrastructure and enhancing our digital experience as we expand our reach to organically acquire new banking relationships.  Our greater scale, coupled with improvements in asset quality, position F&M for continued success.”

Selected financial highlights include:

  • Net income of $2.5 million for the quarter ended March 31, 2022.
  • Total deposit increase of $32.0 million (2.96%) and $249.5 million (28.9%), respectively for the quarter and for the trailing twelve months.
  • Loans held for investment increase of $3.0 million (.46%) and $35.1 million (5.64%), respectively for the quarter and for the trailing twelve months (excluding PPP loans).
  • Nonperforming assets as a percent of total assets decreased to .39% from .45% at year end and .57% on March 31, 2021.
  • Past due loans still accruing decreased to 0.36% of loans held for investment (net of PPP) from 0.49% at year end and 0.52% on March 31, 2021.
  • Recovery of Provision for Loan Losses of $450,000 for the quarter.
  • Allowance for loan losses of 1.12% of loans held for investment, excluding PPP.


BALANCE SHEET

Loans

Loans held for investment; net of PPP have grown 5.64% since March 31, 2021.  The Agriculture, C&I, CRE and dealer portfolios have experienced growth throughout the quarter and year to date, while the Company has seen a reduction in consumer loans specifically in the 1-4 family residential loan area.


LOAN PORTFOLIO
(dollars in thousands) 3/31/2022 12/31/2021 Change 3/31/2021 Change
Commercial  $         290,452  $     286,500  $       3,952  $    267,792  $       22,660
Agriculture               82,460           81,879             581          70,556           11,904
Dealer             111,238         107,346           3,892          96,370           14,868
Consumer             169,617         173,556         (3,939)        183,046         (13,429)
Other                 3,733             5,205         (1,472)            4,608              (875)
Loans held for Investment, net of PPP  $         657,500  $     654,486  $       3,014  $    622,372  $       35,128


Investments

The Company has continued to leverage excess funds into the available for sale (AFS) investment portfolio in the first quarter of 2022 growing $57.9 million to $462 million.  The portfolio is a strong mix of U.S. Treasuries, Agencies, Mortgaged-backed securities, Municipals, and Corporate bonds.  The average tax equivalent yield on the portfolio is 1.54% which has equated to $1.5 million in income for the first quarter compared to $461 thousand in the same quarter last year.


AFS INVESTMENT PORTFOLIO
(dollars in thousands) 3/31/22 12/31/21 Change 3/31/21 Change
US Treasury  $        42,868  $        29,482  $       13,386  $        29,421  $        13,447
Agency          158,540          133,714  $       24,826            24,877  $       133,663
Mortgage-Backed Securities          197,594          183,647  $       13,947            85,406  $       112,188
Municipals            32,674            34,337  $        (1,663)            20,692  $        11,982
Corporates            30,146            22,702  $         7,444            11,307  $        18,839
Total Securities  $       461,822  $       403,882  $       57,940  $       171,703  $       290,119
 
Securities Quarterly Income  $             1,497  $             1,102  $               395  $                 461  $             1,036


Deposits

The Company’s deposit growth during the first quarter of 2022 has been in noninterest bearing accounts ($17.6 million) and money market accounts and savings accounts ($21.1 million) with a decline in NOW and other transactional accounts ($3.6 million) and time deposits ($3.2 million).  The Company continues to strategically focus on building primary banking relationships.


DEPOSIT PORFOLIO
(dollars in thousands) 3/31/22 12/31/21 CHANGE 3/31/21 CHANGE
Non Interest Bearing  $       298,676  $         280,993  $           17,683  $         252,265  $           46,411
NOW & Other Transactional           188,342             191,969               (3,627)             119,076               69,266
Money market and Savings           504,611             483,476               21,135             363,377             141,234
Certificates of deposit           120,666             123,857               (3,191)             128,034               (7,368)
Total Deposits  $    1,112,295  $      1,080,295  $           32,000  $         862,752  $         249,543


Asset Quality

Nonperforming loans as a percent of total assets (net of PPP) continue to decline from 0.57% on March 31, 2021 to 0.39% at March 31, 2022.  In addition, classified loans and past due loans declined from the previous twelve months from 9.69% to 6.17% and 0.52% to 0.36%, respectively (net of PPP).


(dollars in thousands) 3/31/2022 12/31/2021 3/31/2021
Non-performing Loans
Non-accrual loans  $           4,751  $               5,465  $             5,755
Over 90 & on Accrual                    48                       43                      28
Total Non-performing Loans  $           4,799  $               5,508  $             5,783
NPL As A % of Total Assets, net of PPP 0.39% 0.45% 0.57%
Watch Total  $         21,901  $             24,140  $           30,681
As A % Of Loans, net of PPP 3.31% 3.67% 4.88%
Substandard Total  $         18,969  $             19,713  $           30,179
As A % Of Loans, net of PPP 2.86% 2.99% 4.80%
Total Watch List  $         40,870  $             43,853  $           60,860
Total Classified As A % of Total Loans, net of PPP 6.17% 6.66% 9.69%
Past Due Loans
30-59 Days Past Due  $           2,093  $               2,751  $             2,730
60-89 Days Past Due                  273                      432                    495
90+ Days Past Due                    48                       43                      28
Total Past Due Loans  $           2,414  $               3,226  $             3,253
Deliquency %, net of PPP 0.36% 0.49% 0.52%


Allowance for Loan and Lease Losses

The allowance for loan losses as a percentage of loans held for investment, net of PPP has declined from 1.56% at March 31, 2021 to 1.12% at March 31, 2022.  This decline has been driven by improved asset quality in regard to non-performing, classified and past due loans.  Uncertainty in the economy related to the war in Ukraine, inflation and supply chain issues were factored into the allowance for loan losses this quarter as well as growth in the portfolio over the trailing twelve months.  The resulting reversal of provision was accretive to quarterly earnings by $450 thousand.


3/31/2022 12/31/2021 3/31/2021
(dollars in thousands)
Provision for Loan Losses  $     (450)  $      (590)  $     (725)
Allowance for Loan and Leases Losses  $     7,389  $      7,748  $     9,704
ALLL as a % of Loans Held for Investment, net of PPP 1.12% 1.18% 1.56%


INCOME STATEMENT

Net Interest Income

Net interest income reflects growth over the year ended 12/31/21 and quarter ended 3/31/21 of $177 thousand and $380 thousand, respectively.  As yields on earning assets continue to decline the Company has been able to support net interest income with savings in interest expense and growth in the investment portfolio while seeking opportunities to leverage the growth in liquidity into higher yielding assets.  During the quarter the Company was able to purchase bonds as the market yields climbed.  This should add to net interest income in future quarters.


Margin compression has reduced the net interest margin from 3.44% on March 31, 2021, to 2.82% on March 31, 2022.  To mitigate this compression, the Company has continued to invest excess funds into securities with better yields.  The Company has also slightly reduced cost of funds since March 31, 2021 to 34 basis points through maintaining deposit rates, debt reduction and growth in noninterest bearing deposits.


Noninterest Income

Noninterest income of $2.5 million for the quarter was slightly higher than year end 12/31/21 of $2.4 million but a decline from March 31, 2021, which was $3.4 million.   Mortgage originations have declined as rates have increased, as a result the Company is focused on expanding mortgage originators into our newer markets, continuing to utilize our title company and growing our wealth management division.


Noninterest expense

Focusing on infrastructure enhancements, digital processes and expanding into our newer markets has resulted in growth in noninterest expense of 11.25% in the trailing twelve months.  Some of the growth is attributed to the charitable donation of a property to the local community, disposing of non-income producing properties and eliminating outdated products.


Paycheck Protection Program

The Company processed 1,080 Paycheck Protection Program (“PPP”) & CARES Act loans during 2020 and 2021 totaling $87.1 million.  Fees associated with these loans are amortized over the life of the loan or recognized fully when repaid or forgiven.  The Company holds $2.1 million in PPP loans as of March 31, 2022 and recognized $169,000 in PPP fee income in the first quarter.


Dividends Declaration

            On April 21, 2022, our Board of Directors declared a fourth quarter dividend of $.26 per share to common shareholders. Based on our most recent trade price of $30.00 per share this constitutes a 3.47% yield on an annualized basis. The dividend will be paid on May 30, 2022, to shareholders of record as of May 15, 2022.”


F & M Bank Corp. is an independent, locally owned, financial holding company, offering a full range of financial services, through its subsidiary, Farmers & Merchants Bank’s thirteen banking offices in Rockingham, Shenandoah, and Augusta Counties, Virginia and the city of Winchester, VA. The Bank also provides additional services through a loan production office located in Penn Laird, VA, a loan production office in Winchester, VA and through its subsidiaries, F&M Mortgage and VSTitle, both of which are located in Harrisonburg, VA.  Additional information may be found by contacting us on the internet at www.fmbankva.com or by calling (540) 896-1705.


F & M Bank Corp.

Key Statistics

2022 2021
Q1 Q4 Q3 Q2 Q1
Net Income (000’s)  $      2,528  $           1,380  $            2,337  $            3,220  $           3,801
Net Income available to Common  $      2,528  $           1,379  $            2,272  $            3,154  $           3,736
Earnings per common share – basic  $        0.74  $             0.39  $              0.71  $              0.98  $             1.17
Earnings per common share – diluted  $        0.74  $             0.40  $              0.68  $              0.93  $             1.11
Return on Average Assets 0.89% 0.46% 0.81% 1.22% 1.56%
Return on Average Equity 10.51% 5.42% 9.18% 13.06% 15.96%
Dividend Payout Ratio excluding Special Dividend 35.14% 66.67% 36.62% 26.53% 22.22%
Net Interest Margin 2.82% 2.48% 2.95% 3.13% 3.44%
Yield on Average Earning Assets 3.17% 3.15% 3.35% 3.56% 3.92%
Yield on Average Interest Bearing Liabilities 0.49% 0.96% 0.57% 0.62% 0.70%
Net Interest Spread 2.68% 2.19% 2.78% 2.94% 3.22%
Provision for Loan Losses (000’s)  $       (450)  $            (590)  $            (235)  $         (1,250)  $            (725)
Net Charge-offs  $         (92)  $                72  $                 61  $            (272)  $                45
Net Charge-offs as a % of Loans -0.01% 0.04% 0.04% -0.16% 0.03%
Non-Performing Loans (000’s)  $      4,799  $           5,508  $            5,430  $            5,532  $           5,783
Non-Performing Loans to Total Assets 0.39% 0.45% 0.46% 0.50% 0.57%
Non-Performing Assets (000’s)  $      4,799  $           5,508  $            5,430  $            5,532  $           5,783
Non-Performing Assets to Assets 0.39% 0.45% 0.46% 0.50% 0.57%
Efficiency Ratio 78.68% 82.13% 75.99% 76.07% 68.00%


(1)   The net interest margin is calculated by dividing tax equivalent net interest income by total average earning assets. Tax equivalent interest income is calculated by grossing up interest income for the amounts that are nontaxable (i.e. municipal securities and loan income) then subtracting interest expense. The tax rate utilized is 21%. The Company’s net interest margin is a common measure used by the financial service industry to determine how profitable earning assets are funded. Because the Company earns nontaxable interest income from municipal loans and securities, net interest income for the ratio is calculated on a tax equivalent basis as described above.

(2)   The efficiency ratio is not a measurement under accounting principles generally accepted in the United States. The efficiency ratio is a common measure used by the financial service industry to determine operating efficiency. It is calculated by dividing non-interest expense by the sum of tax equivalent net interest income and non-interest income excluding gains and losses on the investments portfolio and Other Real Estate Owned. The Company calculates this ratio in order to evaluate how efficiently it utilizes its operating structure to create income. An increase in the ratio from period to period indicates the Company is losing a greater percentage of its income to expenses.


This press release may contain “forward-looking statements” as defined by federal securities laws, which may involve significant risks and uncertainties. These statements address issues that involve risks, uncertainties, estimates and assumptions made by management, and actual results could differ materially from the results contemplated by these forward-looking statements. Factors that could have a material adverse effect on our operations and future prospects include, but are not limited to, changes in interest rates, general economic conditions, legislative and regulatory policies, and a variety of other matters. Other risk factors are detailed from time to time in our Securities and Exchange Commission filings. Readers should consider these risks and uncertainties in evaluating forward-looking statements and should not place undue reliance on such statements. We undertake no obligation to update these statements following the date of this press release.


SOURCE:         F & M Bank Corp.

CONTACT:        Carrie Comer EVP/Chief Financial Officer

540-896-1705 or ccomer@fmbankva.com


F&M Bank Opens Old Town Winchester Banking Center 

A second branch location will follow in late 2022

TIMBERVILLE, Va. (April 25, 2022) – On Monday, April 18, F&M Bank continued its growth in Winchester with a new banking center located in historic Old Town Winchester. This is F&M Bank’s 13th branch in Virginia. Later in 2022, a second Winchester branch location is slated to open west of Old Town on Amherst Street.

F&M Bank identified Winchester as a strategic growth opportunity due to its thriving local economy, prospering businesses, robust non-profit network, and a community that’s committed to preserving its history while at the same time looking to the future.

“As a bank with more than 100 years of history we look to do business with people and communities that align with our values – and for us, Winchester is a perfect match,” said Mike Wilkerson, Chief Lending Officer and Winchester Market Executive. “The ‘Top of Virginia’ is thriving and our sweet spots of agriculture, non-profit and business banking reflect the needs of our community. In a world of bank consolidation and branch closures, F&M is committed to organic growth and market expansion. When we expand our ability to serve our customers, everybody wins.”

In January 2021, F&M Bank opened a commercial banking and loan production office in the Winchester market with an experienced banking team that has a 20-year history of working together. This northern Shenandoah Valley market has accrued over $36 million in deposits and $21 million in loans. Mr. Wilkerson leads the team, consisting of John Sargent, SVP, and Jonathan Reimer, SVP, Commercial Relationship Managers; and Gail Pryde, Business Relationship Specialist.

Today, with the announcement of its Old Town location opening, this team is excited to leverage their 150 years of combined banking experience to deliver customized loan, deposit, and cash management solutions to business and personal customers.

Lauren Fravel has been named as Banking Center Specialist for the Old Town Winchester location. Lauren brings over 25 years of experience to the team and is eager to welcome new customers. The banking center will also employ associates for F&M Mortgage and VS Title in the coming months.

The branch is located at 3 South Cameron Street, at the corner of Boscawen and Cameron Streets. Hours are 8:30am am to 5:00 pm with extensive digital offerings available online and on the F&M Bank mobile app.

Should I Bank Local in Virginia? What to Consider When Choosing a Financial Institution

Are you new to the Shenandoah Valley and having trouble deciding on where to bank? Unhappy with your current financial institution and looking to switch? Whether you’re looking for a financial institution for personal deposit accounts, mortgage financing, or business banking needs, it can be tough to decide whether to choose a large bank that you see across the country or a local bank with roots in your community, such as F&M Bank. In this article, we’ll help you understand what makes local financial institutions stand out, along with some perks of community banks that you may not be aware of.

What are the different types of financial institutions?

Finding a local, community-focused financial institution such as F&M Bank is ideal, as F&M offers robust digital banking capabilities as well as conveniently located physical branch locations.

Banks are a crucial part of the U.S. monetary system because they move U.S. currency and provide necessary liquidity to personal and business entities. There are two sets of bank regulators, Federal and State. At the federal level, The Office of the Comptroller of the Currency (OCC), part of the Treasury, charters and supervises national banks. At the state level, banks that don’t work across state lines can be state-chartered. The FDIC oversees state-chartered banks that aren’t members of the Federal Reserve System.


F&M Bank can be traced to 1908, when it started its operation as a state-chartered bank; in 1983 F&M Bank was incorporated in Virginia and became a registered bank holding company. As a bank holding company it is a full-service financial institution, offering complete consumer, business, and financial services – including a full array of digital banking capabilities as well as physical branch locations for your banking needs (as opposed to institutions such as Internet-only banks and credit unions). You will even find that F&M Bank’s online services offer the same capabilities as national banks!

  • Internet banks: No physical branches, just a website and mobile banking app. Online banks may not have national charters themselves, instead partnering with a traditional bank to hold customer deposits.
  • Credit unions: Financial institutions that are owned by their members and have certain criteria for membership.


Differences between banks and credit unions

F&M Bank prioritizes benefitting the community they serve, which you will not typically find from a national bank or credit union.

Working with a local financial institution like F&M Bank will likely be your best option. When deciding on where to open a bank account, consider some of the key differences between banks and credit unions:


  • Credit unions typically have fewer branch locations and financial products/services than banks.
  • Local community banks like F&M Bank benefit their community through local partnerships, events, and volunteer opportunities.
  • F&M Bank offers the most convenience and resources through digital banking on your mobile or other personal devices, along with a variety of options for nearby, conveniently located physical branch locations.
  • Local banks like F&M Bank offer unrivaled expertise related to your community, understanding how to resolve your specific needs for personal and business banking and lending that credit unions or nationwide banks are unable to provide.

Benefits of banking local for your personal deposit accounts

When it comes to your checking and savings accounts, it’s nice to have branch locations conveniently located near your house or job. And not just any branch, but one staffed with friendly employees who live and work in the same community as you. For example, F&M Bank has developed a lot of local expertise over the years. We’ve been supporting personal banking needs in the Shenandoah Valley since 1908. Local banks like F&M also offer branch services like on-site safe deposit boxes and in-house notary services.


Of course, web-based banking tools mean you don’t have to visit a branch just to deposit a check or transfer money between accounts. Local banks have embraced technology in recent years and now offer the same tools as the bigger banks. Enjoy the convenience of banking where and how you want with online banking, mobile banking, person to person payments, and mobile wallet. F&M Bank’s rating in the App Store is 4.8 out of 5 stars – higher than you will find for other options both nationally and locally.

Benefits of banking local for your lending needs

For your lending needs, it is best to look for an institution that has expertise in your community that can offer flexible options to meet your financing needs.

Applying for a loan can be stressful, especially if it’s your first time. The friendly loan officers at your local bank can guide you through the process, turning it from stressful to smooth and pleasant. Whether a home, car, or personal loan, they’ll help you review your options to find the right loan with a payment plan you can afford.

Mortgage Lending

While there are national trends in real estate, it’s still a very local business. The housing market can vary widely from community to community, so working with a local mortgage lender gives you access to local expertise, as well as more flexible lending options. Learn more about the mortgage loans offered by F&M Bank.

Personal Loans

Whether you need an Auto Loan to finance the purchase of your next vehicle, or a general consumer loan to use for a variety of expenses, local decision-making helps you get the right loan. Enjoy swift and local application processing, and greater flexibility in approving loans, from your local bank. When you come to a local lender like F&M Bank, we aim to put you at ease with the loan application process. Learn more about our personal loans.

Benefits of staying local for Wealth Management

Choosing a financial advisor is all about trust. Will they put your best interests first? Do they have experience working with clients who share your background, such as small business owners, blended families, etc.? Whether you are in Harrisonburg or closer to Broadway and Edinburg, you can find local financial advisors who will offer a higher level of service and possess a wealth of local knowledge.


Staying local for Wealth Management means working with a financial advisor who understands your community and can recommend local investment opportunities such as those on our Local Market Dashboard.


Investment and insurance products and services are offered through Osaic Institutions, Inc., Member FINRA/SIPC. F&M Financial Services is a trade name of F&M Bank. Osaic Institutions and F&M Bank are not affiliated.

Securities and Insurance Products:

Not Guaranteed by the Bank | Not FDIC Insured | Not a Deposit | Not Insured by Any Federal Government Agency | May Lose Value Including Loss of Principal

Bank local with F&M!

Now that you understand the benefits of banking locally, you probably want to find a local financial partner who understands your needs. At F&M Bank, you’ll find personalized attention with customizable solutions for your personal banking needs. In-house decision-making simplifies loan applications and local financial planners understand the community they serve. Get started now! Contact us or visit your nearest branch location in Harrisonburg, Augusta County, or Staunton in the Shenandoah Valley.