F&M Bank – Farmers & Merchants Bank Names New Chief of Development and New Chief Credit Officer
F&M Bank – Farmers & Merchants Bank Names New Chief of Development and New Chief Credit Officer
For Immediate Release | Timberville, VA. August 24, 2022 – F&M Bank, a subsidiary of F&M Bank Corp., is pleased to announce the promotion of Paul Eberly to Chief Development Officer and Jason Withers to Chief Credit Officer. This change is made in response to the company’s expanding loan portfolio in the small business and agricultural industries.
Eberly, former Chief Credit Officer for F&M Bank, stated “I’m honored to work with a company that prioritizes our local agricultural needs, and I’m thrilled to work more directly with our local farmers and to support our initiatives in this space.”
Withers has been with F&M Bank since April 2021 and has over 15 years of commercial credit experience. Jason commented, “I look forward to expanding my role and managing our credit portfolio as F&M Bank continues to support the ever-changing financing needs of our communities.” Withers has deep ties to the Shenandoah Valley and graduated from Coastal Carolina University.
Mark Hanna, F&M Bank’s President & CEO, is available for additional comment. Please call (540) 896-1743 or contact Jacob Mowry at jmowry@fmbankva.com.
About F&M Bank
F&M Bank Corp. (OTCQX: FMBM) proudly remains the only publicly traded organization based in Rockingham County, VA, and since 1908, has served the Shenandoah Valley through its banking subsidiary F&M Bank, with full-service branches and a wide variety of financial services, including home loans through F&M Mortgage, and real estate settlement services and title insurance through VSTitle. Both individuals and businesses find the organization’s local decision-making, and up-to-date technology provides the kind of responsive, knowledgeable, and reliable service that only a progressive community bank can. F&M Bank has grown to $1 billion in assets with more than 175 full and part-time employees. Its conservative approach to finances and sound investments, along with excellent customer service, has made F&M Bank profitable and continues to pave the way for a bright future.
###
F&M Bank Announces 33% Increase in Starting Wages
Timberville, VA. August 4, 2022 – F&M Bank, a subsidiary of F&M Bank Corp, increased its employees’ starting wages from $15 to $20 per hour, a 33% increase, effective August 1, 2022. This minimum hourly pay rate is substantially above the Commonwealth of Virginia’s minimum hourly rate of $11.00 and the federal minimum hourly wage rate of $7.25.
“Our employees are our greatest asset, and we are committed to maintaining a living wage for all members of the F&M team,” said F&M Bank CEO, Mark Hanna. “This increase is made possible by the incredible effort and dedication our team puts forth to support the financial needs of our communities.”
F&M Bank’s commitment to its employees is also reflected in the Company’s Employee Stock Ownership Plan (ESOP), which is designed to help support employees’ retirement goals by growing retirement funds in direct correlation with the success of their daily work. Other benefits provided by the company include a Quarterly Wellness Reimbursement for employees prioritizing their health, a $10,000 tuition reimbursement for continued education, an above-average starting Paid Time Off allotment and opportunities for internal advancement.
“We are excited by the productivity of our team and the things we have been able to accomplish,” commented Melody Emswiler, F&M Bank Chief Human Resources Officer, “This increase is a reflection that at F&M we are committed to our employees, and we value them. We want to share our success that has been accomplished by serving our community.”
F&M Bank was recently named among the top three best banks in Virginia by Virginia Living Magazine. For a complete list of career opportunities at F&M Bank, please visit their careers page.
About F&M Bank
F&M Bank Corp. (OTCQX: FMBM) proudly remains the only publicly traded organization based in Rockingham County, VA, and since 1908, has served the Shenandoah Valley through its banking subsidiary F&M Bank, with full-service branches and a wide variety of financial services, including home loans through F&M Mortgage, and real estate settlement services and title insurance through VSTitle. Both individuals and businesses find the organization’s local decision-making, and up-to-date technology provides the kind of responsive, knowledgeable, and reliable service that only a progressive community bank can. F&M Bank has grown to $1 billion in assets with more than 175 full and part-time employees. Its conservative approach to finances and sound investments, along with excellent customer service, has made F&M Bank profitable and continues to pave the way for a bright future.
F&M Bank – Farmers & Merchants Bank Announce Investment in BankTech Ventures Fund
Timberville, VA. August 2, 2022 – F&M Bank, also known as Farmers & Merchants Bank, announced today that it has committed to be an investor in BankTech Ventures, LP (“BTV” or the “Fund”), a strategic investment fund with the mission to support community banks through investment and education around banking technology. With general partners from The Venture Center, the Independent Community Bankers of America (“ICBA”), Hovde Group and two leading community banks, Coastal Community Bank and Sunwest Bank, BankTech Ventures partners with premier community banks to identify emerging technologies for investment and use by them.
Supported and endorsed by the ICBA and The Venture Center, which was named Finovate’s 2020 Best Accelerator of the Year, BankTech Ventures is building an ecosystem that pairs community banks with emerging technology companies that can serve banks’ immediate needs whether it be regulatory, customer acquisition, process improvement, or other areas of focus. The Fund ultimately aims to provide its bank investors with the opportunity to obtain significant research & development “spend” at a much lower cost than if undertaken in-house, as well as strong returns from the underlying company investments. With a limited partner base of over 100 community banks across the US, the strategic value of the fund’s ecosystem for both bank-focused startups and community banks is unprecedented.
“Through our affiliation with the ICBA’s ThinkTECH Accelerator program, F&M Bank has initiated partnerships with several of the past and current emerging financial technology companies,” said Mark Hanna, President & CEO of F&M Bank. “We have been extremely impressed with the management of these companies and the services they provide which will enable F&M to better serve our clients and our communities. Expanding our commitment to innovation in the form of a financial investment in BankTech Ventures was the next logical step in aligning our mutual interests with these emerging businesses.”
“We are thrilled to welcome F&M Bank to BankTech Ventures,” said Carey Ransom, Managing Director of BankTech Ventures. “From our first conversation with them, their commitment to innovation was clear, and they have already been a valuable participant in our ecosystem – collaborating with our team, other banks, and the startup companies with bank-enabling solutions. We look forward to the continued partnership.”
BankTech Ventures, LP (www.banktechventures.com) has raised over $100M for its first fund and has over 100 initial limited partners, including F&M Bank. The fund has already made 6 investment and continues to evaluate several investment opportunities. In addition to Ransom, the fund’s other general partners are Eric Sprink, CEO of Coastal Community Bank; Carson Lappetito, President of Sunwest Bank; Steve Hovde, Chairman & CEO of Hovde Group; Charles Potts, Chief Innovation Officer, ICBA; and Wayne Miller, Executive Director, The Venture Center.
Mark Hanna, F&M Bank’s President & CEO, is available for additional comment. Please call (540) 896-1743 or contact Jacob Mowry at jmowry@fmbankva.com
About F&M Bank
F&M Bank Corp. (OTCQX: FMBM) proudly remains the only publicly traded organization based in Rockingham County, VA, and since 1908, has served the Shenandoah Valley through its banking subsidiary F&M Bank, with full-service branches and a wide variety of financial services, including home loans through F&M Mortgage, and real estate settlement services and title insurance through VSTitle. Both individuals and businesses find the organization’s local decision-making, and up-to-date technology provide the kind of responsive, knowledgeable, and reliable service that only a progressive community bank can. F&M Bank has grown to $1 billion in assets with more than 175 full and part-time employees. Its conservative approach to finances and sound investments, along with excellent customer service, has made F&M Bank profitable and continues to pave the way for a bright future.
About BankTech Ventures, LP.
Established in 2021, BankTech Ventures, LP is the first venture fund created for and by key leaders in community banking, bank technology and fintech. BTV serves the community banking ecosystem through strategic investments, education and collaboration with its limited partners and ICBA members by delivering a de-risked and/or fully vetted network of leading and emerging bank technology companies to enhance a community bank’s value, as well as aim for strong returns from the underlying investments in these companies. Learn more at www.banktechventures.com.
F & M Bank Corp. Announces Second Quarter 2022 Earnings And Dividend
TIMBERVILLE, VA / ACCESSWIRE / July 28, 2022 / F & M Bank Corp. (OTCQX:FMBM), parent company (the Company) of Farmers & Merchants Bank today reported earnings for quarter ending June 30, 2022.
Mark Hanna, President, commented “ F&M Bank had earnings of $1.8 million in the second quarter of 2022 which were driven by strong loan demand within our Shenandoah Valley Communities. Loans outstanding grew $32 million in the past quarter as we continue to build a solid pipeline of future opportunities. Given challenging economic and market conditions, we strive to maintain our disciplined approach to growth, pricing and underwriting. Our investment portfolio continues to contribute meaningfully to earnings and our deposits growth has leveled off with a slight decline during the quarter. While we did add $600 thousand to our provision for loan losses this quarter due to the loan growth and economic uncertainty, our core operating earnings are strong and growing. The strategic focus of developing our team, improving our infrastructure, and maintaining our asset quality while developing lasting relationships in our community continues to position F&M for future success.”
Selected financial highlights include:
- Net income of $1.8 million for the quarter ended June 30, 2022.
- Total deposit decreases of $12 million (1.09%), increases of $20.0 million (1.84%) and increases of $144.9 million (15.16%), respectively for the quarter, year to date and for the trailing twelve months.
- Loans held for investment increase of $32.3 million (4.92%), $35.3 million (5.40%) and $51.6 million (8.08%), respectively for the quarter, year to date and for the trailing twelve months (excluding PPP loans).
- Nonperforming loans as a percent of total assets decreased to .15% from .45% at year end and .50% on June 30, 2021.
- Provision for loan losses of $600 thousand for the quarter and $150 thousand year to date.
- Allowance for loan losses of 1.12% of loans held for investment, excluding PPP.
BALANCE SHEET
Loans
Loans held for investment; net of PPP have grown 8.08% since June 30, 2021, and 9.97% since December 31, 2021. The Agriculture, C&I, CRE and dealer portfolios have experienced growth throughout the quarter and year to date, while the Company has seen a reduction in consumer loans specifically in the 1-4 family residential loan area.
|
(dollars in thousands)
|
6/30/2022 | 12/31/2021 | Change | 6/30/2021 | Change | |||||||||||||||
|
Commercial
|
$ | 311,126 | $ | 286,500 | $ | 24,626 | $ | 277,475 | $ | 33,651 | ||||||||||
|
Agriculture
|
91,269 | 81,879 | 9,390 | 74,205 | 17,064 | |||||||||||||||
|
Dealer
|
119,758 | 107,346 | 12,412 | 101,435 | 18,323 | |||||||||||||||
|
Consumer
|
164,771 | 173,556 | (8,785 | ) | 179,993 | (15,222 | ) | |||||||||||||
|
Other
|
2,901 | 5,205 | (2,304 | ) | 5,119 | (2,218 | ) | |||||||||||||
|
Loans held for Investment, net of PPP
|
$ | 689,825 | $ | 654,486 | $ | 35,339 | $ | 638,227 | $ | 51,598 | ||||||||||
Investments
The Company has continued to leverage excess funds into the available for sale (AFS) investment portfolio in the second quarter of 2022. Since the beginning of the year, the investment portfolio has gown $42.9 million to $447 million. The portfolio is a strong mix of U.S. Treasuries, Agencies, Mortgaged-backed securities, Municipals, and corporate bonds. The average tax equivalent yield on the portfolio is 1.67% which has equated to $2.0 million in income compared to $536 thousand in the same period last year.
AFS INVESTMENT PORTFOLIO
|
($000s)
|
6/30/22 | 12/31/21 | Change | 6/30/21 | Change | |||||||||||||||
|
US Treasury
|
$ | 46,737 | $ | 29,482 | $ | 17,255 | $ | 29,406 | $ | 17,331 | ||||||||||
|
Agency
|
156,148 | 133,714 | $ | 22,434 | 24,735 | $ | 131,413 | |||||||||||||
|
Mortgage Backed Securities
|
171,031 | 183,647 | $ | (12,616 | ) | 91,426 | $ | 79,605 | ||||||||||||
|
Municipals
|
43,686 | 34,337 | $ | 9,349 | 29,332 | $ | 14,354 | |||||||||||||
|
Corporates
|
29,221 | 22,702 | $ | 6,519 | 13,755 | $ | 15,466 | |||||||||||||
|
Total Securities
|
$ | 446,823 | $ | 403,882 | $ | 42,941 | $ | 188,654 | $ | 258,169 | ||||||||||
|
Securities Quarterly Income
|
$ | 1,970 | $ | 1,102 | $ | 868 | $ | 536 | $ | 1,434 | ||||||||||
Deposits
During the second quarter of 2022, the Company experienced a slight decline in deposits. However, growth for the year is 1.84%. The Company continues to strategically focus on building primary banking relationships which is reflected in the $11 million growth in noninterest bearing accounts.
DEPOSIT PORFOLIO
|
(dollars in thousands)
|
6/30/22 | 12/31/21 | Change | 6/30/21 | Change | |||||||||||||||
|
Non Interest. Bearing
|
$ | 291,728 | $ | 280,993 | $ | 10,735 | $ | 269,618 | $ | 22,110 | ||||||||||
|
NOW & Other Transactional
|
193,037 | 191,969 | 1,068 | 150,323 | 42,714 | |||||||||||||||
|
Money market and Savings
|
500,108 | 483,476 | 16,632 | 403,714 | 96,394 | |||||||||||||||
|
Certificates of deposit
|
115,337 | 123,857 | (8,520 | ) | 131,689 | (16,352 | ) | |||||||||||||
|
Total Deposits
|
$ | 1,100,210 | $ | 1,080,295 | $ | 19,915 | $ | 955,344 | $ | 144,866 | ||||||||||
| 1.84 | 15.16 | |||||||||||||||||||
Asset Quality
Nonperforming loans as a percent of total assets (net of PPP) continue to decline from 0.50% on June 30, 2021, to 0.15% on June 30, 2022. Classified loans declined from the previous twelve months from 9.14% to 6.82%, respectively (net of PPP). The Company did experience a slight increase in delinquencies from 0.37% on June 30, 2021, to 0.59% at June 30, 2022 with the majority of the increase in the 30-59 days.
|
(000’s)
|
6/30/2022 | 12/31/2021 | 6/30/2021 | |||||||||
|
Non-performing Loans
|
||||||||||||
|
Non-accrual loans
|
$ | 1,851 | $ | 5,465 | $ | 5,532 | ||||||
|
Over 90 & on Accrual
|
55 | 43 | – | |||||||||
|
Total Non-performing Loans
|
$ | 1,906 | $ | 5,508 | $ | 5,532 | ||||||
|
NPL As A % of Total Assets, net of PPP
|
0.15 | % | 0.45 | % | 0.50 | % | ||||||
|
Watch Total
|
$ | 31,663 | $ | 24,140 | $ | 36,406 | ||||||
|
As A % Of Loans, net of PPP
|
4.56 | % | 3.67 | % | 5.65 | % | ||||||
|
Substandard Total
|
$ | 15,738 | $ | 19,713 | $ | 22,423 | ||||||
|
As A % Of Loans, net of PPP
|
2.27 | % | 2.99 | % | 3.48 | % | ||||||
|
Total Watch List
|
$ | 47,401 | $ | 43,853 | $ | 58,829 | ||||||
|
Total Classified As A % of Total Loans, net of PPP
|
6.82 | % | 6.66 | % | 9.14 | % | ||||||
|
Past Due Loans
|
||||||||||||
|
30-59 Days Past Due
|
$ | 3,304 | $ | 2,751 | $ | 1,640 | ||||||
|
60-89 Days Past Due
|
762 | 432 | 716 | |||||||||
|
90+ Days Past Due
|
41 | 43 | – | |||||||||
|
Total Past Due Loans
|
$ | 4,107 | $ | 3,226 | $ | 2,356 | ||||||
|
Deliquency %, net of PPP
|
0.59 | % | 0.49 | % | 0.37 | % | ||||||
|
Performing TDRs
|
||||||||||||
|
Real estate
|
1,914 | 1,930 | 2,547 | |||||||||
|
Commercial
|
2,082 | 2,826 | 2,167 | |||||||||
|
HE
|
– | 148 | 669 | |||||||||
|
Other
|
86 | 95 | 831 | |||||||||
Allowance for Loan and Lease Losses
The allowance for loan losses as a percentage of loans held for investment, net of PPP has declined from 1.35% on June 30, 2021, to 1.12% on June 30, 2022. This decline has been driven by improved asset quality as evidenced by the decline in nonperforming assets and classified loans. Uncertainty in the economy related to the war in Ukraine, inflation, supply chain issues, increase in past due loans, growth in the portfolio over the trailing twelve months and the increase in interest rates were all factored in the allowance for loan loss calculation resulting in a provision for loan losses of $600 for the quarter and $150 for the year.
| Three months ended | Six months ended | |||||||||||||||||||
| 6/30/2022 | 3/31/2022 | 6/30/2021 | 6/30/2022 | 6/30/2021 | ||||||||||||||||
|
(000’s)
|
||||||||||||||||||||
|
Provision for Loan Losses
|
$ | 600 | $ | (450 | ) | $ | (1,250 | ) | $ | 150 | $ | (1,975 | ) | |||||||
|
Allowance for Loan and Leases Losses
|
$ | 7,798 | $ | 7,389 | $ | 8,705 | $ | 7,798 | $ | 8,705 | ||||||||||
|
ALLL as a % of Loans Held for Investment, net of PPP
|
1.12 | % | 1.12 | % | 1.35 | % | 1.12 | % | 1.35 | % | ||||||||||
INCOME STATEMENT
Net Interest Income
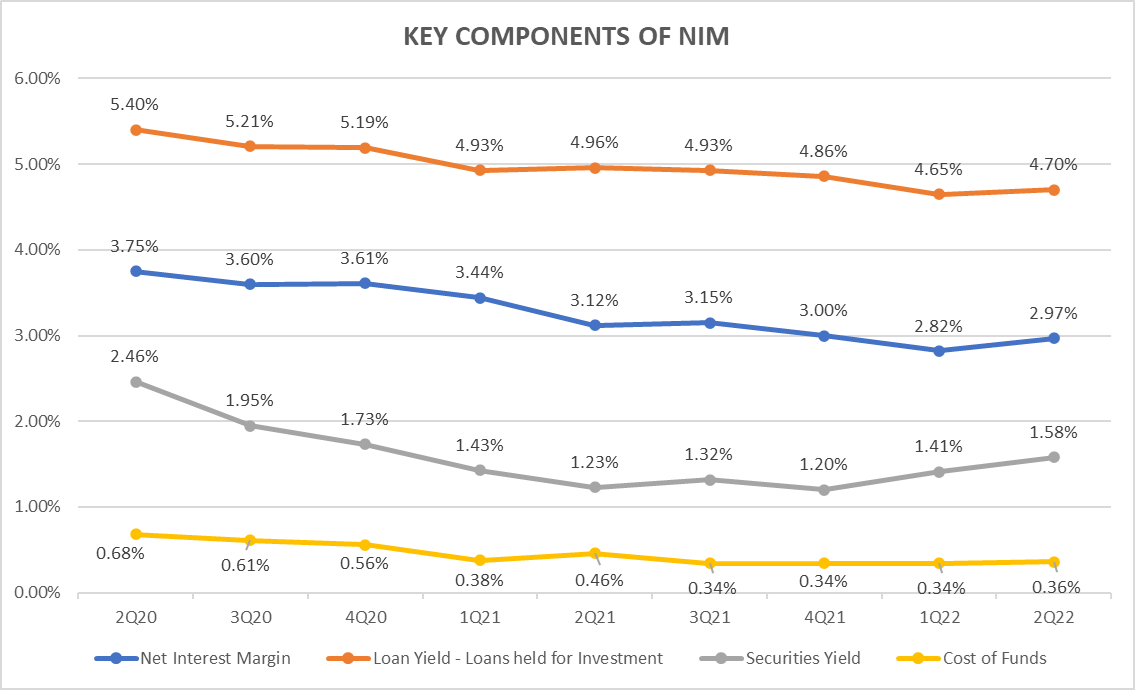
Quarterly net interest income reflects growth of $1 million over first quarter and $1.3 million over June 30, 2021. This growth is attributed to the income produced by the investment portfolio that has continued to grow in the second quarter of 2022, increases in variable rate loan rates, growth in the loan portfolio and the lower cost of funds.
Margin compression has reduced the net interest margin from 3.12% on June 30, 2021, to 2.97% on June 30, 2022, however for the second consecutive quarter net interest margin increased from the December 31, 2021, margin of 2.82%. We are seeing the results of the Company’s efforts to mitigate compression by continuing to invest excess funds into securities with better yields and growth in the loan portfolio. The Company has also slightly reduced cost of funds since June 30, 2021, to 36 basis points through maintaining deposit rates and growth in noninterest bearing deposits.
Noninterest Income
Noninterest income of $2.4 million for the quarter is slightly lower than first quarter ($2.5 million) and a decline from June 30, 2021, which was $3.0 million. Mortgage originations have declined as rates have increased. As a result, the Company is focused on expanding mortgage originators into our newer markets and offering variable rate products to our mortgage customers. The Company is also continuing to utilize our title company and growing our wealth management division.
Noninterest expense
Focusing on infrastructure enhancements, developing our team and expanding into our newer markets has resulted in growth in noninterest expense of 3.6% in the trailing twelve months.
Paycheck Protection Program
The Company processed 1,080 Paycheck Protection Program (“PPP”) & CARES Act loans during 2020 and 2021 totaling $87.1 million. Fees associated with these loans are amortized over the life of the loan or recognized fully when repaid or forgiven. The Company holds $671 thousand in PPP loans as of June 30, 2022, and recognized $54 thousand in PPP fee income in the second quarter.
Dividends Declaration
On July 21, 2022, our Board of Directors declared a second quarter dividend of $.26 per share to common shareholders. Based on our most recent trade price of $25.48 per share this constitutes a 4.08% yield on an annualized basis. The dividend will be paid on August 29, 2022, to shareholders of record as of August 14, 2022.”
F & M Bank Corp. is an independent, locally owned, financial holding company, offering a full range of financial services, through its subsidiary, Farmers & Merchants Bank’s thirteen banking offices in Rockingham, Shenandoah, and Augusta Counties, Virginia and the city of Winchester, VA. The Bank also provides additional services through a loan production office located in Penn Laird, VA, a loan production office in Winchester, VA and through its subsidiaries, F&M Mortgage and VSTitle, both of which are located in Harrisonburg, VA. Additional information may be found by contacting us on the internet at www.fmbankva.com or by calling (540) 896-1705.
F & M Bank Corp.
Key Statistics
| 2022 | 2021 | |||||||||||||||||||||||
| Q2 | Q1 | YTD | Q2 | Q1 | YTD | |||||||||||||||||||
|
Net Income (000’s)
|
$ | 1,789 | $ | 2,528 | $ | 4,317 | $ | 3,220 | $ | 3,801 | $ | 7,021 | ||||||||||||
|
Net Income available to Common
|
$ | 1,789 | $ | 2,528 | $ | 4,317 | $ | 3,154 | $ | 3,736 | $ | 6,890 | ||||||||||||
|
Earnings per common share – basic
|
$ | 0.51 | $ | 0.74 | $ | 1.25 | $ | 0.98 | $ | 1.17 | $ | 2.15 | ||||||||||||
|
Earnings per common share – diluted
|
$ | – | $ | – | $ | – | $ | 0.93 | $ | 1.11 | $ | 2.04 | ||||||||||||
|
Return on Average Assets
|
0.58 | % | 0.83 | % | 0.76 | % | 1.22 | % | 1.56 | % | 1.39 | % | ||||||||||||
|
Return on Average Equity
|
8.97 | % | 10.88 | % | 8.92 | % | 13.06 | % | 15.96 | % | 14.78 | % | ||||||||||||
|
Dividend Payout Ratio
|
50.98 | % | 35.14 | % | 41.60 | % | 26.53 | % | 22.22 | % | 24.19 | % | ||||||||||||
|
Net Interest Margin
|
3.15 | % | 2.82 | % | 2.97 | % | 3.13 | % | 3.44 | % | 3.27 | % | ||||||||||||
|
Yield on Average Earning Assets
|
3.50 | % | 3.17 | % | 3.32 | % | 3.56 | % | 3.92 | % | 3.72 | % | ||||||||||||
|
Yield on Average Interest Bearing Liabilities
|
0.48 | % | 0.49 | % | 0.49 | % | 0.62 | % | 0.70 | % | 0.66 | % | ||||||||||||
|
Net Interest Spread
|
3.02 | % | 2.68 | % | 2.83 | % | 2.94 | % | 3.22 | % | 3.06 | % | ||||||||||||
|
Provision for Loan Losses (000’s)
|
$ | 600 | $ | (450 | ) | $ | 150 | $ | (1,250 | ) | $ | (725 | ) | $ | (1,975 | ) | ||||||||
|
Net Charge-offs
|
$ | 192 | $ | (92 | ) | $ | 100 | $ | (272 | ) | $ | 45 | $ | (227 | ) | |||||||||
|
Net Charge-offs as a % of Loans
|
0.03 | % | -0.01 | % | 0.02 | % | -0.16 | % | 0.03 | % | -0.03 | % | ||||||||||||
|
Non-Performing Loans (000’s)
|
$ | 1,906 | $ | 4,799 | $ | 1,906 | $ | 5,532 | $ | 5,783 | $ | 5,532 | ||||||||||||
|
Non-Performing Loans to Total Assets
|
0.15 | % | 0.39 | % | 0.15 | % | 0.50 | % | 0.57 | % | 0.50 | % | ||||||||||||
|
Non-Performing Assets (000’s)
|
$ | 2,103 | $ | 4,799 | $ | 2,103 | $ | 5,532 | $ | 5,783 | $ | 5,532 | ||||||||||||
|
Non-Performing Assets to Assets
|
0.17 | % | 0.39 | % | 0.17 | % | 0.50 | % | 0.57 | % | 0.50 | % | ||||||||||||
|
Efficiency Ratio
|
75.73 | % | 78.68 | % | 77.14 | % | 76.07 | % | 68.00 | % | 72.00 | % | ||||||||||||
- The net interest margin is calculated by dividing tax equivalent net interest income by total average earning assets. Tax equivalent interest income is calculated by grossing up interest income for the amounts that are nontaxable (i.e. municipal securities and loan income) then subtracting interest expense. The tax rate utilized is 21%. The Company’s net interest margin is a common measure used by the financial service industry to determine how profitable earning assets are funded. Because the Company earns nontaxable interest income from municipal loans and securities, net interest income for the ratio is calculated on a tax equivalent basis as described above.
- The efficiency ratio is not a measurement under accounting principles generally accepted in the United States. The efficiency ratio is a common measure used by the financial service industry to determine operating efficiency. It is calculated by dividing non-interest expense by the sum of tax equivalent net interest income and non-interest income excluding gains and losses on the investments portfolio and Other Real Estate Owned. The Company calculates this ratio in order to evaluate how efficiently it utilizes its operating structure to create income. An increase in the ratio from period to period indicates the Company is losing a greater percentage of its income to expenses.
This press release may contain “forward-looking statements” as defined by federal securities laws, which may involve significant risks and uncertainties. These statements address issues that involve risks, uncertainties, estimates and assumptions made by management, and actual results could differ materially from the results contemplated by these forward-looking statements. Factors that could have a material adverse effect on our operations and future prospects include, but are not limited to, changes in interest rates, general economic conditions, legislative and regulatory policies, and a variety of other matters. Other risk factors are detailed from time to time in our Securities and Exchange Commission filings. Readers should consider these risks and uncertainties in evaluating forward-looking statements and should not place undue reliance on such statements. We undertake no obligation to update these statements following the date of this press release.
Income Statement
| Three months ended | Six months ended | |||||||||||||||||||
| 6/30/2022 Unaudited | 3/31/2022 Audited | 6/30/2021 Audited | 6/30/2022 Unaudited | 6/30/2021 Unaudited | ||||||||||||||||
|
(dollars in thousands)
|
||||||||||||||||||||
|
Interest and Dividend Income
|
$ | 10,009 | $ | 9,061 | $ | 8,819 | $ | 19,070 | $ | 17,566 | ||||||||||
|
Interest Expense
|
1,008 | 1,004 | 1,069 | 2,012 | 2,137 | |||||||||||||||
|
Net Interest Income
|
9,001 | 8,057 | 7,750 | 17,058 | 15,429 | |||||||||||||||
|
Non-Interest Income
|
2,368 | 2,483 | 3,086 | 4,851 | 6,441 | |||||||||||||||
|
Provision for Loan Losses
|
600 | (450 | ) | (1,250 | ) | 150 | (1,975 | ) | ||||||||||||
|
Loss on sale of securities
|
97 | – | – | 97 | – | |||||||||||||||
|
Impairment of long-lived assets
|
– | – | – | – | – | |||||||||||||||
|
Other Non-Interest Expenses
|
8,752 | 8,550 | 8,444 | 17,302 | 16,130 | |||||||||||||||
|
Income Before Income Taxes
|
1,920 | 2,440 | 3,642 | 4,360 | 7,715 | |||||||||||||||
|
Provision for Income Taxes
|
131 | (88 | ) | 422 | 43 | 693 | ||||||||||||||
|
Net Income
|
$ | 1,789 | $ | 2,528 | $ | 3,220 | $ | 4,317 | $ | 7,022 | ||||||||||
|
Dividend on preferred stock
|
– | – | 66 | – | 66 | |||||||||||||||
|
Net Income available to common shareholders
|
$ | 1,789 | $ | 2,528 | $ | 3,154 | $ | 4,317 | $ | 6,956 | ||||||||||
|
Average Common Shares Outstanding
|
3,452,711 | 3,434,892 | 3,207,978 | 3,443,850 | 3,206,534 | |||||||||||||||
|
Net Income Per Common Share
|
$ | 0.51 | $ | 0.74 | 0.98 | $ | 1.25 | $ | 2.15 | |||||||||||
|
Dividends Declared
|
$ | 0.26 | $ | 0.26 | $ | 0.26 | $ | 0.26 | $ | 0.26 | ||||||||||
Balance Sheet
| 6/30/2022 Unaudited | 12/31/2021 Audited | Change | 6/30/2021 Unaudited | Change | ||||||||||||||||
|
(dollars in thousands)
|
||||||||||||||||||||
|
Cash and Due from Banks
|
$ | 13,636 | $ | 8,579 | $ | 5,057 | $ | 15,415 | $ | (1,779 | ) | |||||||||
|
Interest Bearing Bank Deposits
|
187 | 2,875 | $ | (2,688 | ) | 3,901 | $ | (3,714 | ) | |||||||||||
|
Federal Funds Sold
|
3,430 | 76,667 | $ | (73,237 | ) | 166,698 | $ | (163,268 | ) | |||||||||||
|
Loans Held for Sale
|
5,448 | 4,887 | $ | 561 | 8,855 | $ | (3,407 | ) | ||||||||||||
|
Loans Held for Investment
|
690,497 | 662,422 | $ | 28,075 | 660,956 | $ | 29,541 | |||||||||||||
|
Less Allowance for Loan Losses
|
(7,798 | ) | (7,748 | ) | $ | (50 | ) | (8,727 | ) | $ | 929 | |||||||||
|
Net Loans Held for Investment
|
682,699 | 654,674 | $ | 28,025 | 652,229 | $ | 30,470 | |||||||||||||
|
Securities
|
456,635 | 413,217 | $ | 43,418 | 198,814 | $ | 257,821 | |||||||||||||
|
Other Assets
|
59,517 | 58,443 | $ | 1,074 | 59,063 | $ | 454 | |||||||||||||
|
Total Assets
|
$ | 1,221,552 | $ | 1,219,342 | $ | 2,210 | $ | 1,104,975 | $ | 116,577 | ||||||||||
|
Deposits
|
1,100,210 | 1,080,295 | $ | 19,915 | 955,344 | $ | 144,866 | |||||||||||||
|
Long Term Debt
|
11,788 | 21,772 | $ | (9,984 | ) | 31,310 | $ | (19,522 | ) | |||||||||||
|
Other Liabilities
|
47,604 | 16,819 | $ | 30,785 | 18,109 | $ | 29,495 | |||||||||||||
|
Total Liabilities
|
1,159,602 | 1,118,886 | $ | 40,716 | 1,004,763 | $ | 154,839 | |||||||||||||
|
Preferred Stock
|
– | – | $ | – | 4,558 | $ | (4,558 | ) | ||||||||||||
|
Common Equity
|
71,950 | 100,456 | $ | (28,506 | ) | 95,654 | $ | (23,704 | ) | |||||||||||
|
Stockholders’ Equity
|
71,950 | 100,456 | $ | (28,506 | ) | 100,212 | $ | (28,262 | ) | |||||||||||
|
Total Liabilities and Stockholders’ Equity
|
$ | 1,231,552 | $ | 1,219,342 | $ | 12,210 | $ | 1,104,975 | $ | 126,577 | ||||||||||
|
Book Value Per Common Share
|
$ | 21.01 | $ | 29.42 | $ | 29.80 | ||||||||||||||
|
Tangible Book Value Per Common Share
|
$ | 20.06 | $ | 28.47 | $ | 29.98 | ||||||||||||||
CONTACT:
Carrie Comer EVP/Chief Financial Officer
540-896-1705 or ccomer@fmbankva.com
SOURCE: F & M Bank Corp.
View source version on accesswire.com:
https://www.accesswire.com/710009/F-M-Bank-Corp-Announces-Second-Quarter-2022-Earnings-And-Dividend
F&M Bank Welcomes Commercial Lender Ben Thompson to its Growing Team
F&M Bank’s leadership team welcomes Ben Thompson to his new role as a Commercial Relationship Manager. Mr. Thompson joins F&M Bank most recently from National Bank and brings with him 6 years of retail and commercial banking experience.
Ben commented, “I’m excited to join this well-established banking team. I look forward to making new connections and growing relationships to provide our clients a best-in-class community banking experience.”
In this role, Ben will build client relationships, supporting small and large Virginia-based businesses. F&M Bank’s President Senior Vice President and Market Leader, Katherine Preston commented, “We are thrilled to have Ben join the commercial team. He brings a wealth of client experience and finance knowledge to this position and will be integral to our strategic goals moving forward.”
Ben earned a bachelor’s degree from Radford University. He enjoys spending time with family, golfing, and fishing and is passionate about assisting in a client’s success. Ben will support the bank’s market service area and be based at the Crossroads bank branch in Harrisonburg, VA.
Contact Ben at the “Get in Touch” form directly below!
Best of Virginia 2022
F&M Bank has been grateful to play a part in the growth of Virginia’s economy and remains committed to being a locally owned and publicly traded community bank right here where we all live, work and play.
In May 2022, Virginia Living Magazine announced results for its “Best of Virginia” annual list following a readers’ survey conducted earlier in the year. Our teammates are beyond humbled to be recognized among the top three Best Banking Services in the Shenandoah Valley region. Thank you, readers, neighbors and friends, for your vote. We appreciate it!
Follow us out on the OTC Market Index: #FMBM. Look for @fmbankva on social media channels for the latest news, events and community updates!
F&M Bank Corp Announces First Quarter 2022 Earnings
F & M Bank Corp. News and Financials
TIMBERVILLE, VA—April 25, 2022—F & M Bank Corp. (OTCQX: FMBM), parent company (the Company) of Farmers & Merchants Bank today reported net income of $2.5 million for quarter ending March 31, 2022.
Mark Hanna, President, commented “First quarter of 2022 has been a strong quarter for F&M bank with net income of $2.5 million. Deposits grew this quarter another 2.96% and have been deployed into $3 million of net loan growth, excluding PPP and $58 million of new investments in bonds to capitalize on the rising rate environment. We continue to focus strategically on improving our infrastructure and enhancing our digital experience as we expand our reach to organically acquire new banking relationships. Our greater scale, coupled with improvements in asset quality, position F&M for continued success.”
Selected financial highlights include:
- Net income of $2.5 million for the quarter ended March 31, 2022.
- Total deposit increase of $32.0 million (2.96%) and $249.5 million (28.9%), respectively for the quarter and for the trailing twelve months.
- Loans held for investment increase of $3.0 million (.46%) and $35.1 million (5.64%), respectively for the quarter and for the trailing twelve months (excluding PPP loans).
- Nonperforming assets as a percent of total assets decreased to .39% from .45% at year end and .57% on March 31, 2021.
- Past due loans still accruing decreased to 0.36% of loans held for investment (net of PPP) from 0.49% at year end and 0.52% on March 31, 2021.
- Recovery of Provision for Loan Losses of $450,000 for the quarter.
- Allowance for loan losses of 1.12% of loans held for investment, excluding PPP.
BALANCE SHEET
Loans
Loans held for investment; net of PPP have grown 5.64% since March 31, 2021. The Agriculture, C&I, CRE and dealer portfolios have experienced growth throughout the quarter and year to date, while the Company has seen a reduction in consumer loans specifically in the 1-4 family residential loan area.
| LOAN PORTFOLIO | |||||
| (dollars in thousands) | 3/31/2022 | 12/31/2021 | Change | 3/31/2021 | Change |
| Commercial | $ 290,452 | $ 286,500 | $ 3,952 | $ 267,792 | $ 22,660 |
| Agriculture | 82,460 | 81,879 | 581 | 70,556 | 11,904 |
| Dealer | 111,238 | 107,346 | 3,892 | 96,370 | 14,868 |
| Consumer | 169,617 | 173,556 | (3,939) | 183,046 | (13,429) |
| Other | 3,733 | 5,205 | (1,472) | 4,608 | (875) |
| Loans held for Investment, net of PPP | $ 657,500 | $ 654,486 | $ 3,014 | $ 622,372 | $ 35,128 |
Investments
The Company has continued to leverage excess funds into the available for sale (AFS) investment portfolio in the first quarter of 2022 growing $57.9 million to $462 million. The portfolio is a strong mix of U.S. Treasuries, Agencies, Mortgaged-backed securities, Municipals, and Corporate bonds. The average tax equivalent yield on the portfolio is 1.54% which has equated to $1.5 million in income for the first quarter compared to $461 thousand in the same quarter last year.
| AFS INVESTMENT PORTFOLIO | |||||
| (dollars in thousands) | 3/31/22 | 12/31/21 | Change | 3/31/21 | Change |
| US Treasury | $ 42,868 | $ 29,482 | $ 13,386 | $ 29,421 | $ 13,447 |
| Agency | 158,540 | 133,714 | $ 24,826 | 24,877 | $ 133,663 |
| Mortgage-Backed Securities | 197,594 | 183,647 | $ 13,947 | 85,406 | $ 112,188 |
| Municipals | 32,674 | 34,337 | $ (1,663) | 20,692 | $ 11,982 |
| Corporates | 30,146 | 22,702 | $ 7,444 | 11,307 | $ 18,839 |
| Total Securities | $ 461,822 | $ 403,882 | $ 57,940 | $ 171,703 | $ 290,119 |
| Securities Quarterly Income | $ 1,497 | $ 1,102 | $ 395 | $ 461 | $ 1,036 |
Deposits
The Company’s deposit growth during the first quarter of 2022 has been in noninterest bearing accounts ($17.6 million) and money market accounts and savings accounts ($21.1 million) with a decline in NOW and other transactional accounts ($3.6 million) and time deposits ($3.2 million). The Company continues to strategically focus on building primary banking relationships.
| DEPOSIT PORFOLIO | |||||
| (dollars in thousands) | 3/31/22 | 12/31/21 | CHANGE | 3/31/21 | CHANGE |
| Non Interest Bearing | $ 298,676 | $ 280,993 | $ 17,683 | $ 252,265 | $ 46,411 |
| NOW & Other Transactional | 188,342 | 191,969 | (3,627) | 119,076 | 69,266 |
| Money market and Savings | 504,611 | 483,476 | 21,135 | 363,377 | 141,234 |
| Certificates of deposit | 120,666 | 123,857 | (3,191) | 128,034 | (7,368) |
| Total Deposits | $ 1,112,295 | $ 1,080,295 | $ 32,000 | $ 862,752 | $ 249,543 |
Asset Quality
Nonperforming loans as a percent of total assets (net of PPP) continue to decline from 0.57% on March 31, 2021 to 0.39% at March 31, 2022. In addition, classified loans and past due loans declined from the previous twelve months from 9.69% to 6.17% and 0.52% to 0.36%, respectively (net of PPP).
| (dollars in thousands) | 3/31/2022 | 12/31/2021 | 3/31/2021 |
| Non-performing Loans | |||
| Non-accrual loans | $ 4,751 | $ 5,465 | $ 5,755 |
| Over 90 & on Accrual | 48 | 43 | 28 |
| Total Non-performing Loans | $ 4,799 | $ 5,508 | $ 5,783 |
| NPL As A % of Total Assets, net of PPP | 0.39% | 0.45% | 0.57% |
| Watch Total | $ 21,901 | $ 24,140 | $ 30,681 |
| As A % Of Loans, net of PPP | 3.31% | 3.67% | 4.88% |
| Substandard Total | $ 18,969 | $ 19,713 | $ 30,179 |
| As A % Of Loans, net of PPP | 2.86% | 2.99% | 4.80% |
| Total Watch List | $ 40,870 | $ 43,853 | $ 60,860 |
| Total Classified As A % of Total Loans, net of PPP | 6.17% | 6.66% | 9.69% |
| Past Due Loans | |||
| 30-59 Days Past Due | $ 2,093 | $ 2,751 | $ 2,730 |
| 60-89 Days Past Due | 273 | 432 | 495 |
| 90+ Days Past Due | 48 | 43 | 28 |
| Total Past Due Loans | $ 2,414 | $ 3,226 | $ 3,253 |
| Deliquency %, net of PPP | 0.36% | 0.49% | 0.52% |
Allowance for Loan and Lease Losses
The allowance for loan losses as a percentage of loans held for investment, net of PPP has declined from 1.56% at March 31, 2021 to 1.12% at March 31, 2022. This decline has been driven by improved asset quality in regard to non-performing, classified and past due loans. Uncertainty in the economy related to the war in Ukraine, inflation and supply chain issues were factored into the allowance for loan losses this quarter as well as growth in the portfolio over the trailing twelve months. The resulting reversal of provision was accretive to quarterly earnings by $450 thousand.
| 3/31/2022 | 12/31/2021 | 3/31/2021 | |
| (dollars in thousands) | |||
| Provision for Loan Losses | $ (450) | $ (590) | $ (725) |
| Allowance for Loan and Leases Losses | $ 7,389 | $ 7,748 | $ 9,704 |
| ALLL as a % of Loans Held for Investment, net of PPP | 1.12% | 1.18% | 1.56% |
INCOME STATEMENT
Net Interest Income
Net interest income reflects growth over the year ended 12/31/21 and quarter ended 3/31/21 of $177 thousand and $380 thousand, respectively. As yields on earning assets continue to decline the Company has been able to support net interest income with savings in interest expense and growth in the investment portfolio while seeking opportunities to leverage the growth in liquidity into higher yielding assets. During the quarter the Company was able to purchase bonds as the market yields climbed. This should add to net interest income in future quarters.
Margin compression has reduced the net interest margin from 3.44% on March 31, 2021, to 2.82% on March 31, 2022. To mitigate this compression, the Company has continued to invest excess funds into securities with better yields. The Company has also slightly reduced cost of funds since March 31, 2021 to 34 basis points through maintaining deposit rates, debt reduction and growth in noninterest bearing deposits.
Noninterest Income
Noninterest income of $2.5 million for the quarter was slightly higher than year end 12/31/21 of $2.4 million but a decline from March 31, 2021, which was $3.4 million. Mortgage originations have declined as rates have increased, as a result the Company is focused on expanding mortgage originators into our newer markets, continuing to utilize our title company and growing our wealth management division.
Noninterest expense
Focusing on infrastructure enhancements, digital processes and expanding into our newer markets has resulted in growth in noninterest expense of 11.25% in the trailing twelve months. Some of the growth is attributed to the charitable donation of a property to the local community, disposing of non-income producing properties and eliminating outdated products.
Paycheck Protection Program
The Company processed 1,080 Paycheck Protection Program (“PPP”) & CARES Act loans during 2020 and 2021 totaling $87.1 million. Fees associated with these loans are amortized over the life of the loan or recognized fully when repaid or forgiven. The Company holds $2.1 million in PPP loans as of March 31, 2022 and recognized $169,000 in PPP fee income in the first quarter.
Dividends Declaration
| On April 21, 2022, our Board of Directors declared a fourth quarter dividend of $.26 per share to common shareholders. Based on our most recent trade price of $30.00 per share this constitutes a 3.47% yield on an annualized basis. The dividend will be paid on May 30, 2022, to shareholders of record as of May 15, 2022.”
F & M Bank Corp. is an independent, locally owned, financial holding company, offering a full range of financial services, through its subsidiary, Farmers & Merchants Bank’s thirteen banking offices in Rockingham, Shenandoah, and Augusta Counties, Virginia and the city of Winchester, VA. The Bank also provides additional services through a loan production office located in Penn Laird, VA, a loan production office in Winchester, VA and through its subsidiaries, F&M Mortgage and VSTitle, both of which are located in Harrisonburg, VA. Additional information may be found by contacting us on the internet at www.fmbankva.com or by calling (540) 896-1705.
F & M Bank Corp. Key Statistics
(1) The net interest margin is calculated by dividing tax equivalent net interest income by total average earning assets. Tax equivalent interest income is calculated by grossing up interest income for the amounts that are nontaxable (i.e. municipal securities and loan income) then subtracting interest expense. The tax rate utilized is 21%. The Company’s net interest margin is a common measure used by the financial service industry to determine how profitable earning assets are funded. Because the Company earns nontaxable interest income from municipal loans and securities, net interest income for the ratio is calculated on a tax equivalent basis as described above. (2) The efficiency ratio is not a measurement under accounting principles generally accepted in the United States. The efficiency ratio is a common measure used by the financial service industry to determine operating efficiency. It is calculated by dividing non-interest expense by the sum of tax equivalent net interest income and non-interest income excluding gains and losses on the investments portfolio and Other Real Estate Owned. The Company calculates this ratio in order to evaluate how efficiently it utilizes its operating structure to create income. An increase in the ratio from period to period indicates the Company is losing a greater percentage of its income to expenses.
This press release may contain “forward-looking statements” as defined by federal securities laws, which may involve significant risks and uncertainties. These statements address issues that involve risks, uncertainties, estimates and assumptions made by management, and actual results could differ materially from the results contemplated by these forward-looking statements. Factors that could have a material adverse effect on our operations and future prospects include, but are not limited to, changes in interest rates, general economic conditions, legislative and regulatory policies, and a variety of other matters. Other risk factors are detailed from time to time in our Securities and Exchange Commission filings. Readers should consider these risks and uncertainties in evaluating forward-looking statements and should not place undue reliance on such statements. We undertake no obligation to update these statements following the date of this press release.
|
|||||||||||||||||||||||||||||||||||||||||||||||||||||||||||||||||||||||||||||||||||||||||||||||||||||||||||||||||||||||||||||||||||||||||||||||||||||||||||||||||||||||||||||||
SOURCE: F & M Bank Corp.
CONTACT: Carrie Comer EVP/Chief Financial Officer
540-896-1705 or ccomer@fmbankva.com
F&M Bank Opens Old Town Winchester Banking Center
A second branch location will follow in late 2022
TIMBERVILLE, Va. (April 25, 2022) – On Monday, April 18, F&M Bank continued its growth in Winchester with a new banking center located in historic Old Town Winchester. This is F&M Bank’s 13th branch in Virginia. Later in 2022, a second Winchester branch location is slated to open west of Old Town on Amherst Street.
F&M Bank identified Winchester as a strategic growth opportunity due to its thriving local economy, prospering businesses, robust non-profit network, and a community that’s committed to preserving its history while at the same time looking to the future.
“As a bank with more than 100 years of history we look to do business with people and communities that align with our values – and for us, Winchester is a perfect match,” said Mike Wilkerson, Chief Lending Officer and Winchester Market Executive. “The ‘Top of Virginia’ is thriving and our sweet spots of agriculture, non-profit and business banking reflect the needs of our community. In a world of bank consolidation and branch closures, F&M is committed to organic growth and market expansion. When we expand our ability to serve our customers, everybody wins.”
In January 2021, F&M Bank opened a commercial banking and loan production office in the Winchester market with an experienced banking team that has a 20-year history of working together. This northern Shenandoah Valley market has accrued over $36 million in deposits and $21 million in loans. Mr. Wilkerson leads the team, consisting of John Sargent, SVP, and Jonathan Reimer, SVP, Commercial Relationship Managers; and Gail Pryde, Business Relationship Specialist.
Today, with the announcement of its Old Town location opening, this team is excited to leverage their 150 years of combined banking experience to deliver customized loan, deposit, and cash management solutions to business and personal customers.
Lauren Fravel has been named as Banking Center Specialist for the Old Town Winchester location. Lauren brings over 25 years of experience to the team and is eager to welcome new customers. The banking center will also employ associates for F&M Mortgage and VS Title in the coming months.
The branch is located at 3 South Cameron Street, at the corner of Boscawen and Cameron Streets. Hours are 8:30am am to 5:00 pm with extensive digital offerings available online and on the F&M Bank mobile app.
National Ag Day with F&M Bank
National Ag Day
National Ag Day is March 22, 2022! Virginia’s agricultural production is one of the most diverse in the nation. Many Virginia commodities and products rank in the top 10 among all U.S. states. Our local farmers, and other agriculture experts, represent a leading group of industry movers and shakers that support our economy and sustain life for our region, and beyond.
Virginia is home to over 43,000 farms that cover nearly 8 million acres across the Commonwealth. 98% of all farms in the United States are family-owned and operated. These families sacrifice a lot to feed our communities and sustain life throughout our region. F&M strives to thank farmers throughout the year and we encourage our community to take a moment next week to thank a local farmer as we celebrate our farming community!

F&M has been supporting local farmers for over 100 years. We’ve helped farmers navigate several economic cycles from recessions and droughts to boom periods with flourishing production. These experiences and partnerships have helped us develop tailored products that include equipment financing, land expansion, cattle purchases, waste management funding, and lines of credit.
Learn More about our line of Ag products, or contact one of our Agri-Business specialists at agribusiness@fmbankva.com.