F&M Bank is pleased to announce the promotion of Calan Jansen to the position of Senior Vice President. With over 20 years of wealth experience, Calan holds her Series 66, 63, SIE, 7, and 6 licenses, has been an invaluable asset to F&M Bank for the past 8 years, and is an Osaic Institutions Wealth Advisor with F&M Financial Services.
Throughout her career, Calan has consistently demonstrated excellence and has been recognized as one of the top 20 advisors nationally within Osaic Institutions, Inc. Her exceptional skills and expertise have also earned her the distinction of being the leading female advisor within the state of Virginia.
Calan is known for her personalized approach to financial planning, understanding that each individual has unique aspirations, circumstances, and risk tolerances. Her thoughtful and tailored strategies have set her apart in the industry, earning her the trust and confidence of her clients.
When asked about her promotion, Calan stated, “I am honored and excited to take on this new role as Senior Vice President at F&M Financial Services. I look forward to continuing to serve our clients with dedication and expertise, helping them achieve their financial goals and secure their future.”
F&M Bank CEO, Mike Wilkerson, expressed his confidence in Calan’s abilities, saying, “Calan has consistently demonstrated outstanding performance and exceptional leadership throughout her tenure at F&M Bank. Her promotion to Senior Vice President is well-deserved, and I have no doubt that she will excel in this expanded role, further contributing to the success of our organization.”
In addition to her professional achievements, Calan’s team recently achieved a significant milestone by winning the Gold award in the Shenandoah Valley Best contest. This community-voted contest, hosted annually by the Harrisonburg Radio Group, recognizes the excellence and dedication of local businesses within the Shenandoah Valley.*
For more information about F&M Financial Services and to get in touch with Calan Jansen, please visit www.fmbankva.com/calan-jansen.
* F&M Financial Services was awarded Gold in the 2024 Shenandoah Valley Best Contest’s Wealth Management category. The nomination and voting period occurred in March 2024, with results announced publicly in May 2024. Results can be viewed at www.shenandoahvalleybest.com/categories/2024
Investment and insurance products and services are offered through Osaic Institutions, Inc., Member FINRA/SIPC. F&M Financial Services is a trade name of F&M Bank. Osaic Institutions and F&M Bank are not affiliated.
Securities and Insurance Products:
Not Guaranteed by the Bank | Not FDIC Insured | Not a Deposit | Not Insured by Any Federal Government Agency | May Lose Value Including Loss of Principal
F&M Bank Corp. (OTCQX: FMBM) proudly remains the only publicly traded organization based in Rockingham County, VA, and since 1908, has served the Shenandoah Valley through its banking subsidiary F&M Bank, with full-service branches and a wide variety of financial services, including home loans through F&M Mortgage, and real estate settlement services and title insurance through VSTitle. Both individuals and businesses find the organization’s local decision-making and up-to-date technology provide the kind of responsive, knowledgeable, and reliable service that only a progressive community bank can.
https://www.fmbankva.com/wp-content/uploads/2024/08/jcansen-bench.jpg20001500Jacob Mowry/wp-content/themes/fmbank-enfold-child/images/FandMBank_whitelogo.svgJacob Mowry2024-08-20 08:44:092024-08-20 08:44:09F&M Bank and F&M Financial Services Announce the Promotion of Calan Jansen to Senior Vice President
Celebrating F&M Bank’s Birthday: Honoring Our Legacy and Embracing the Future
As F&M Bank celebrates another milestone this month, we reflect on our rich history, core values, community involvement, and robust product offerings. From our inception in 1908 through today, F&M Bank has remained dedicated to supporting the Shenandoah Valley and beyond. We’ve grown a lot in the last 116 years, and F&M Bank is the bank it is today because of the community we serve!
A Legacy of Growth and Community Support
1908: Farmers and Merchants Bank was founded by business owners and farmers in Timberville, marking the beginning of our journey to support local communities.
1910: We launched our first public relations campaign with 500 Christmas postcards, establishing our commitment to community engagement.
1956: Under Chairman Lawrence Hoover, Sr., F&M Bank announced growth to $5 million at the annual shareholders meeting, demonstrating our financial stability and trustworthiness.
1973-1979: We expanded our reach by opening branches in Elkton and Broadway, enhancing our ability to serve more customers in the Shenandoah Valley.
1983: The State Corporation Commission approved the formation of F&M Bank Corp, including TEB Life Insurance Company, solidifying our presence in the financial sector.
1995-2008: Our growth continued with the acquisition of branches in Woodstock and Edinburg, the opening of new branches in Bridgewater and Harrisonburg, and the majority interest purchase in F&M Mortgage.
2012-2014: We expanded our services with a loan production office in Fishersville, an automotive dealer finance division in Harrisonburg, and announced record earnings following stock offerings, leading to new branch openings in Staunton.
2015-2019: F&M Bank continued its expansion with new branches in Staunton, Harrisonburg, Timberville, and Stuarts Draft, reflecting our commitment to accessibility and customer service.
2021-2023: Reaching $1 billion in assets, we expanded into Winchester and Frederick County, opened branches in Waynesboro and Old Town Winchester, renovated our Woodstock Branch, and celebrated our 115th anniversary.
Mid- 2024: We reached $1.3 billion in assets. This year, we launched refreshed core values focusing on GROW.
Core Values: GROW with Us
Our core values—Gregarious, Resolute, Original, and Wholehearted—are the foundation of everything we do.
Gregarious: We cultivate a sense of community and inclusivity, fostering meaningful engagement and leaving a positive impression in every interaction.
Resolute: Our steadfast commitment to accountability, resilience, and continuous improvement drives us to achieve excellence.
Original: We celebrate authenticity and creativity, empowering our team to think outside the box and contribute innovative solutions.
Wholehearted: Our deep sense of purpose, passion, and dedication ensures that we fully embrace our mission and make a lasting impact.
Community Involvement: Building a Brighter Future
F&M Bank’s commitment to the community extends beyond financial services. Our philanthropic efforts and community engagement are at the core of our mission. We’ve launched our pillars that help guide our community impact.
Educational Initiatives: We support financial literacy in schools, offer scholarships, and provide unique opportunities like the “day in the life of a banker” program for high school students.
Volunteer Efforts: Our team actively participates in community events, such as document shred days, and supports local food and agricultural initiatives.
Partnerships and Sponsorships: We build lasting relationships with organizations like the JMU Alumni Association and Big Brothers Big Sisters, contributing to the enrichment and well-being of our community.
Innovative Services: Meeting Modern Needs
F&M Bank remains at the forefront of innovation, offering robust digital banking solutions tailored to meet the needs of our customers. Our services include cash management, merchant services, and a comprehensive suite of banking products designed to support both personal and business financial goals.
Our commitment to technology and security ensures that our customers can bank with confidence, knowing their transactions and personal information are protected. We strive to provide accessible and responsive service, whether in-person or online, to ensure a seamless banking experience.
Looking Ahead: A Future of Promise and Potential
As we celebrate F&M Bank’s birthday, we reflect on our past achievements and look forward to a future filled with promise and potential. Thank you for being a part of our journey. Together, we will continue to grow, thrive, and make a positive impact on the Shenandoah Valley.
F&M continues strong start to 2024 with solid second quarter results.
See associated, unaudited summary consolidated financial data for additional information.
TIMBERVILLE, VA / ACCESSWIRE / July 29, 2024 / F&M Bank Corp. (the “Company” or “F&M”), (OTCQX:FMBM), the parent company of Farmers & Merchants Bank (“F&M Bank” or the “Bank”), today reported results for the quarter and six months ended June 30, 2024.
Net income was $3.0 million or $0.86 per share for the quarter ended June 30, 2024, compared to $1.2 million or $0.35 per share for the linked quarter ended March 31, 2024, and compared to $241,000 or $0.07 per share for the prior year quarter ended June 30, 2023. For the six months ended June 30, 2024, net income was $4.2 million or $1.21 per share, which exceeds net income of $1.3 million, or $0.37 per share, for the same period in 2023. Net income for the six months ended June 30, 2023, included $810,000 in after-tax, one-time expenses, including severance accruals for former bank officers.
On June 30, 2024, the Company had total assets of $1.31 billion, total loans of $826.3 million, and total deposits of $1.19 billion, reflecting growth in second quarter 2024 of $468,000 in total loans and $28.9 million in total deposits. Our loan portfolio consists of a mix of loan types, intended to hedge against risks associated with concentrations in any particular type of loan.
Also noteworthy, the Company’s tangible book value per common share has increased to $22.621 at June 30, 2024 from $21.551 on December 31, 2023. Tangible book value per common share is a non-GAAP financial measure. Further information can be found under the heading “Non-GAAP Financial Measures” and in the footnotes to the table accompanying this release.
“I am pleased to share F&M’s financial results for second quarter and year-to-date 2024,” said Mike Wilkerson, chief executive officer. “During the second quarter, we continued to achieve positive trends in increased revenue and interest income, controlled operational expenses, experienced solid growth in both deposits and loans, and benefited from strong asset quality.
“These results reflect our focus on generating ‘sufficient and sustainable profit,’ which is our number one priority. They also show our focus on the Company’s future, as the execution of our strategic plan continues and as the results from that plan are realized. Across the board, these outcomes and growth are a team effort, with each area and business line of F&M stepping up and contributing. It is through this team effort, for which we are all grateful, that we will continue to grow as a Company and in our ability to serve the people and businesses of the Shenandoah Valley.”
SECOND QUARTER INCOME STATEMENT COMPARISON
Overview
Net income for second quarter 2024 was $3.0 million or $0.86 per share, compared to $1.2 million or $0.35 per share for first quarter 2024, an increase of $1.8 million or $0.51 per share. Return on average assets was 0.93% and return on average equity was 15.59% for the three months ended June 30, 2024. Both ratios are higher than those reported for first quarter 2024. The improvement in net income is attributed primarily to a recovery of credit losses of $458,000 in the second quarter compared to a provision of $824,000 in the first quarter. Also contributing to the improvement, net interest income is $70,000 higher than in the linked quarter. Additionally, noninterest income increased by $644,000 to just under $3.0 million in the second quarter and noninterest expenses declined by $275,000. Due to the improved results, income tax expense increased by $472,000.
Net income increased by $2.8 million or $0.79 per share from the $241,000 or $0.07 per share reported for second quarter 2023. Return on average assets increased by 0.85% and return on average equity increased by 14.26%. The improved results reflect an increase of $422,000 in net interest income, a decrease of $997,000 in the provision for credit losses, an increase of $79,000 in noninterest income and a reduction of $2.2 million in noninterest expenses. Results for second quarter 2023 included a pre-tax severance accrual of $773,000 which lowered net income by $611,000.
Net Interest Income and Net Interest Margin
For second quarter 2024, net interest income totaled $8.2 million, an increase of $70,000 from first quarter 2024, as a $143,000 increase in interest income outpaced a $73,000 increase in interest expense. Net interest margin for the quarter was 2.72%, up eight basis points on a linked quarter basis. Higher loan balances and repricing of adjustable-rate loans contributed to a $142,000 increase in loan interest income, which comprised most of the increase in interest income and increased the earning asset yield by twelve basis points to 5.19%. Cost of funds increased by six basis points to 2.51%. Total interest expense increased by $73,000, a combination of a $614,000 increase in interest expense on deposits and a $542,000 decrease on interest expense on short-term debt. The increase in interest expense on deposits resulted from growth in time deposit balances and higher rates paid on new time deposits. This was partially offset by the decrease in interest expense on short-term debt as Federal Home Loan Bank advances declined from $60.0 million on March 31, 2024, to $20.0 million on June 30, 2024.
Compared to second quarter 2023, net interest margin increased by seven basis points as the earning asset mix shifted from cash and investments to loans. Loans as a percentage of earning assets increased to 68% in second quarter 2024 from 65% in second quarter 2023. Interest income increased $2.1 million, and the earning asset yield increased by 0.55% due to higher average balances and interest rates on loans, federal funds sold and interest-bearing cash balances. Interest expense grew by $1.7 million due to growth in both the average balances of and rates paid on time deposits causing the cost of funds to increase by 0.76%.
Provision for (Recovery of) Credit Losses
During second quarter 2024, the Bank recorded a $458,000 recovery of credit losses compared to an $823,000 provision for credit losses in first quarter 2024 and a $539,000 provision in second quarter 2023. The current quarter recovery was the result of the release of $608,000 in reserves related to the improvement in the collateral value on a $4.2 million individually evaluated loan relationship, net loan charge-offs of $179,000, slower loan growth and an improvement to the experience, depth and ability of lending management qualitative factor used in the Bank’s Allowance for Credit Losses on Loans (“ACLL”) model. By comparison, net charge-offs were $807,000 in first quarter 2024 and $344,000 in second quarter 2023. Also, gross loans grew more during those periods, by $3.8 million in first quarter 2024 and $19.3 million in second quarter 2023. On June 30, 2024, the ACLL totaled $7.8 million or 0.95% of gross loans outstanding.
Noninterest Income
Noninterest income, which includes gains and losses, totaled $3.0 million for second quarter 2024, an increase of $644,000 from first quarter 2024. Several categories of noninterest income increased on a linked quarter basis. Service charges on deposits increased by $18,000, investment services and insurance income increased by $48,000, mortgage banking income increased by $375,000, title insurance income increased by $124,000, and ATM and check card fees increased by $75,000. The other categories of noninterest income combined to increase noninterest income by $5,000.
Compared to second quarter 2023, noninterest income increased by $79,000. The increase resulted from increases of $17,000 in service charges on deposit accounts, $272,000 in investment services and insurance income, $236,000 in mortgage banking income, and $68,000 in title insurance income. There was a decrease of $436,000 in income from bank owned life insurance due to a gain received upon the death of a retired bank officer in 2023. Also, other operating income declined by $90,000. Smaller year-over-year changes in other categories netted to increase noninterest income by another $12,000.
Noninterest Expenses
Noninterest expenses totaled $8.2 million for second quarter 2024, compared to $8.4 million in first quarter 2024 a decrease of $275,000. During second quarter 2024, the Bank recognized $577,000 in gains from lump sum pension distributions, which drove a decrease in employee benefits expense of $514,000. There were decreases of $69,000 in ATM and check card fees, and $12,000 in legal and professional fees. These decreases offset increases of $65,000 in salary expense, $27,000 in occupancy expenses, $33,000 in equipment expense, $21,000 in other real estate owned expenses, $19,000 in telecommunications and data processing expenses, $24,000 in directors’ fees and $126,000 in other operating expenses. There were other changes in noninterest expense categories that combined to increase total noninterest expenses by $5,000.
Compared to the same quarter in 2023, noninterest expenses declined $2.2 million. As a result of the voluntary early exit plan that was implemented in 2023, salary expense declined by $1.2 million. Employee benefits expense declined by $684,000 due to the combination of the voluntary early exit plan and gains received from pension lump sum distributions. There were decreases of $46,000 in equipment expense, $141,000 in advertising expense, $71,000 in legal and professional fees, $88,000 in ATM and check card fees, and $144,000 in other operating expenses. Offsetting these decreases were increases of $88,000 in occupancy expense, $89,000 in FDIC insurance expense, and $41,000 in bank franchise tax expense. The remaining categories combined to increase noninterest expenses by $8,000.
YEAR-TO-DATE INCOME STATEMENT COMPARISON
Overview
Net income for the six months ended June 30, 2024 was $4.2 million or $1.21 per share, compared to $1.3 million or $0.37 per share for the same period in 2023, an increase of $2.9 million or $0.84 per share. Return on average assets was 0.65% and return on average equity was 10.96% for the first half of 2024. Both ratios are higher than those reported for the first six months of 2023. The improvement in net income is attributed primarily to lower noninterest expenses, which declined by $2.8 million to $16.6 million. Net interest income and noninterest income also improved by $709,000 and $231,000, respectively. The year-to-date provision for credit losses decreased from $539,000 in 2023 to $366,000 in 2024.
Net Interest Income and Net Interest Margin
In the first half of 2024, net interest income totaled $16.3 million, an increase of $709,000 from 2023, as a $4.7 million increase in interest income outpaced a $4.0 million increase in interest expense. Net interest margin was 2.71%, up two basis points from the 2.69% reported for the first half of 2023. Higher loan balances and repricing of adjustable-rate loans contributed to a $4.5 million increase in loan interest income, which comprised most of the increase in interest income and increased the earning asset yield by sixty-one basis points to 5.18%. Cost of funds increased by fifty-eight basis points to 2.49%. Total interest expense increased by $4.0 million, due to growth in both the average balances of and rates paid on time deposits.
Provision for Credit Losses
During the first six months of 2024, the Bank recorded a $366,000 provision for credit losses compared to a $539,000 provision for credit losses in the same period in 2023. The provision was the result of $986,000 in net charge-offs, which were partially offset by the release of $608,000 in reserves related to improvement in the collateral value of a $4.2 million individually evaluated loan relationship.
Noninterest Income
Noninterest income, which includes gains and losses, totaled $5.3 million for the first half of 2024, an increase of $231,000 from the first half of 2023. Several categories of noninterest income increased on a year-over-year basis. Service charges on deposit accounts increased by $66,000, investment services and insurance income increased by $345,000, mortgage banking income increased by $92,000, title insurance income increased by $136,000, and ATM and check card fees increased by $39,000. Income on bank owned life insurance declined by $434,000 due to the gains received in 2023. Other categories of noninterest income combined to decrease noninterest income by $13,000.
Noninterest Expenses
Noninterest expenses totaled $16.6 million for first six months of 2024, compared to $19.4 million for the same period of 2023, a decrease of $2.8 million. Salary expense declined by $1.7 million due to cost savings associated with a voluntary early exit plan implemented in fourth quarter 2023. Employee benefits expense declined by $919,000 due to a combination of the voluntary early exit plan, $577,000 in gains from lump sum pension distributions, and a refund of $162,000 received in March 2024 due to better than projected group health insurance claims in 2023. There were declines of $228,000 in advertising expense, $145,000 in other operating expense, $80,000 in ATM and check card fees, and $62,000 in directors’ fees. There were increases of $132,000 in occupancy expenses, $201,000 in FDIC insurance expense and $63,000 in bank franchise tax expense. There were other changes in noninterest expense categories that combined to decrease total noninterest expenses by $3,000.
BALANCE SHEET REVIEW
On June 30, 2024, assets totaled $1.31 billion, an increase of $15.0 million over December 31, 2023. Total loans increased by $4.2 million to $826.3 million, including increases of $8.3 million in residential mortgage loans, $10.3 million in other construction and land development loans, $8.9 million in commercial and industrial loans, and $2.8 million in multifamily loans. These increases were offset by decreases of $6.2 million in automobile loans, $6.0 million in residential construction loans, $1.3 million in credit card and other consumer loans, and $12.0 million in commercial real estate loans.
Investment securities decreased by $23.6 million due to paydowns on U.S. Agency mortgage-backed securities and expected bond maturities, combined with a decrease of $907,000 in unrealized loss on the bond portfolio. On June 30, 2024, the unrealized loss was $39.3 million compared to $40.2 million on December 31, 2023.
Total deposits on June 30, 2024, were $1.19 billion, an increase of $52.0 million from the end of 2023, due to growth of $46.0 million in interest bearing deposits, specifically time deposits, and an increase of $6.0 million in noninterest bearing deposits. On June 30, 2024, 11.34% of the Bank’s total deposits were uninsured.
Shareholders’ equity increased by $3.3 million to $81.6 million due to net income of $4.2 million, a decrease in accumulated other comprehensive loss of $717,000, and $102,000 in shares issued. These increases were offset by $1.8 million in dividends paid to shareholders. Tangible book value per common share has increased to $22.621 from $21.551 on December 31, 2023. Tangible book value per common share is a non-GAAP financial measure. Further information can be found under the heading “Non-GAAP Financial Measures” and in the footnotes to the table accompanying this release.
LIQUIDITY
The Company’s on-balance sheet asset liquidity includes cash and cash equivalents, unpledged investment securities, and loans held for sale, which totaled $200.1 million on June 30, 2024, up from $178.0 million on December 31, 2023.
The Bank had access to off-balance sheet liquidity through unsecured Federal funds lines totaling $90.0 million on June 30, 2024, and December 31, 2023. The Bank has a secured line of credit with the Federal Home Loan Bank (FHLB) with available credit of $150.0 million as of June 30, 2024, and $90.1 million as of December 31, 2023. The FHLB line of credit is secured by a blanket lien on qualifying loans in the residential, commercial, agricultural real estate, and home equity portfolios. The Bank also pledged $206.6 million in securities to the Federal Reserve discount window which may be used for overnight borrowings.
The Bank is scheduled to receive $74.6 million from bond paydowns and maturities by the end of 2024 which can be used to fund future loan growth and for other purposes.
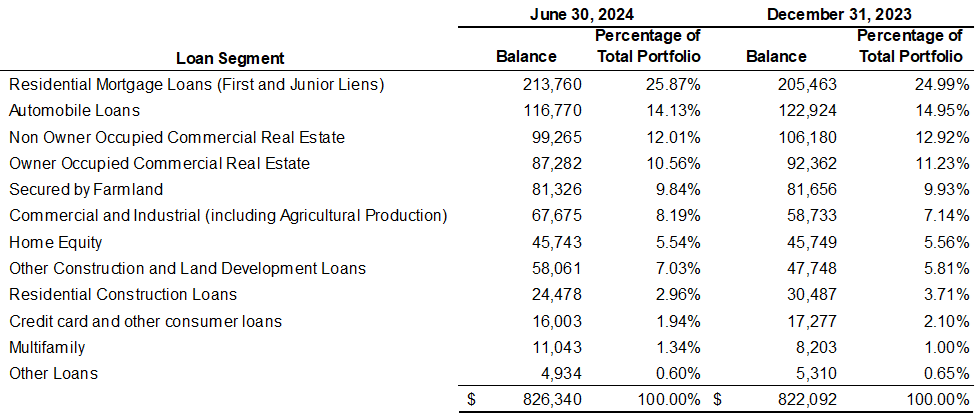
LOAN PORTFOLIO
The Company’s loan portfolio is diversified with its largest segment being residential mortgage loans originated through its subsidiary F&M Mortgage that represents 25.87% of total loans. Total commercial real estate loans, both owner and non-owner occupied constitute $186.5 million or 22.57% of the loan portfolio. Automobile loans originated by its dealer finance division total $116.8 million and 14.13% of the portfolio. Following is a breakdown of the loan portfolio composition as of June 30, 2024, and December 31, 2023 (dollars in thousands):
ASSET QUALITY AND ALLOWANCE FOR CREDIT LOSSES
Nonperforming loans (NPLs) as a percentage of total assets were 0.58% on June 30, 2024, compared to 0.50% on December 31, 2023. Net charge-offs as a percentage of average loans were 0.09% for the quarter ended June 30, 2024, down 0.30% from the linked quarter March 31, 2024, and down 0.09% from second quarter 2023. Year-to-date net charge-offs for 2024 were 0.24% compared to 0.14% for the first six months of 2023.
The current quarter recovery was the result of the release of $608,000 in reserves related to improvement in the collateral value of a $4.2 million individually evaluated loan relationship, net loan charge-offs of $179,000, slower loan growth, and an improvement to the experience, depth and ability of lending management qualitative factor used in the Bank’s ACLL model. By comparison, net charge-offs were $807,000 in first quarter 2024 and $344,000 in second quarter 2023. Gross loans grew by $500,000 in second quarter 2024 and $4.2 million in first quarter 2024. On June 30, 2024, the ACLL totaled $7.8 million or 0.95% of gross loans outstanding compared to $8.3 million or 1.01% of gross loans outstanding at December 31, 2023.
The reserve for unfunded commitments decreased from $690,000 at December 31, 2023, to $575,000 at June 30, 2024, due to decreases in loan commitments of $10.3 million in commercial and industrial loans and $3.6 million in construction and land loans, which were offset by an increase of $2.1 million in commitments for 1-4 family residential construction and $3.1 million in owner-occupied commercial real estate.
DIVIDEND DECLARATION
On July 18, 2024, our Board of Directors declared a second quarter dividend of $0.26 per share to common shareholders. Based on our most recent trade price of $17.25 per share, this constitutes a 6.03% yield on an annualized basis. The dividend will be paid on August 29, 2024, to shareholders of record as of August 14, 2024.
###
ABOUT US
F&M Bank Corp. is an independent, locally owned, financial holding company offering a full range of financial services through our subsidiary, Farmers & Merchants Bank’s (F&M Bank) fourteen banking offices in Rockingham, Shenandoah, and Augusta counties, Virginia, and the cities of Winchester and Waynesboro, Virginia. The Company also owns F&M Mortgage, a mortgage lending subsidiary, and VSTitle, a title company subsidiary. Founded in 1908 as a community venture to serve the farmers and merchants of the Shenandoah Valley, where both the Company and the Bank are headquartered, F&M Bank remains more committed than ever to the success of the agricultural industry, small business ventures, and the nonprofit sector.F&M’s values, which are gregarious, resolute, original, and wholehearted (G.R.O.W.), combined with our brand pillars of sustenance, security, and enrichment, shape the Company’s decision-making, philanthropy, and volunteerism. The only publicly traded organization based in Rockingham County, we offer a diverse suite of financial products and services and a strong team dedicated to living our mission of being the financial partner of choice in the Shenandoah Valley, both today and tomorrow, as we have been since 1908. Additional information may be found by visiting our website, fmbankva.com.
NON-GAAP FINANCIAL MEASURES
The accounting and reporting policies of the Company conform to U.S. generally accepted accounting principles (“GAAP”) and prevailing practices in the banking industry. However, management uses certain non-GAAP measures, including tangible book value per share, to supplement the evaluation of the Company’s financial condition and performance. Management believes presentation of these non-GAAP financial measures provides useful supplemental information that is essential to a proper understanding of the Company’s operating results. These non-GAAP disclosures should not be viewed as a substitute for operating results determined in accordance with GAAP, nor are they necessarily comparable to non-GAAP performance measures that may be presented by other companies. A definition of GAAP to non-GAAP measures is included in the footnotes to the table accompanying this release.
FORWARD-LOOKING STATEMENTS
This press release may contain “forward-looking statements” as defined by federal securities laws, which are subject to significant risks and uncertainties. These include statements regarding future plans, strategies, results, or expectations that are not historical facts, and are generally identified by the use of words such as “believe,” “expect,” “intend,” “anticipate,” “will,” “estimate,” “project” or similar expressions. These statements are based on estimates and assumptions, and our ability to predict results, or the actual effect of future plans or strategies, is inherently uncertain. Our actual results could differ materially from those contemplated by these forward-looking statements. Factors that could have a material adverse effect on our operations and future prospects include, but are not limited to, changes in local and national economies or market conditions; changes in interest rates; regulations and accounting principles; changes in policies or guidelines; loan demand and asset quality, including values of real estate and other collateral; deposit flow; the impact of competition from traditional or new sources; and other factors. Readers should consider these risks and uncertainties in evaluating forward-looking statements and should not place undue reliance on such statements. We undertake no obligation to update these statements following the date of this press release.
F&M Bank Corp. Summary Consolidated Financial Data (unaudited) Dollars in Thousands, except for per share data
Quarter to Date
Year-to-Date
6/30/2024
3/31/2024
12/31/2023 (3)
9/30/2023 (3)
6/30/2023 (3)
6/30/2024
6/30/2023 (3)
Condensed Balance Sheet
Cash and cash equivalents
$
50,459
$
52,486
$
23,717
$
22,159
$
36,505
$
50,459
$
36,505
Investment securities
355,930
369,744
379,557
383,502
394,868
355,930
394,868
Loans held for sale
3,958
1,385
1,119
2,028
881
3,958
881
Gross loans
826,340
825,872
822,092
805,602
776,260
826,340
776,260
Allowance for credit losses
(7,815
)
(8,408
)
(8,321
)
(9,166
)
(8,769
)
(7,815
)
(8,769
)
Goodwill
3,082
3,082
3,082
3,082
3,082
3,082
3,082
Other assets
77,691
72,053
73,350
75,212
75,543
77,691
75,543
Total Assets
$
1,309,645
$
1,316,214
$
1,294,596
$
1,282,419
$
1,278,370
$
1,309,645
$
1,278,370
Noninterest bearing deposits
$
270,246
$
267,106
$
264,254
$
277,219
$
277,578
$
270,246
$
277,578
Interest bearing deposits
915,011
889,237
868,982
856,691
859,534
915,011
859,534
Total Deposits
1,185,257
1,156,343
1,133,236
1,133,910
1,137,112
1,185,257
1,137,112
Short-term debt
20,000
60,000
60,000
60,000
47,000
20,000
47,000
Long-term debt
6,954
6,943
6,932
6,922
6,911
6,954
6,911
Other liabilities
15,818
15,194
16,105
14,567
15,153
15,818
15,153
Total Liabilities
1,228,029
1,238,480
1,216,273
1,215,399
1,206,176
1,228,029
1,206,176
Shareholders’ equity
81,616
77,734
78,323
67,020
72,194
81,616
72,194
Total Liabilities and Shareholders’ Equity
$
1,309,645
$
1,316,214
$
1,294,596
$
1,282,419
$
1,278,370
$
1,309,645
$
1,278,370
Condensed Income Statement
Interest income and fees on loans
$
13,494
$
13,352
$
13,061
$
12,525
$
11,517
$
26,846
$
22,371
Interest income and fees on loans held for sale
46
18
22
19
25
64
47
Income on cash and securities
2,180
2,207
2,074
2,028
2,092
4,387
4,198
Total Interest Income
15,720
15,577
15,157
14,572
13,634
31,297
26,616
Interest expense on deposits
6,951
6,337
6,108
5,811
5,218
13,288
9,255
Interest expense on short-term debt
454
996
812
702
523
1,450
1,514
Interest expense on long-term debt
116
115
116
115
116
231
228
Total Interest Expense
7,521
7,448
7,036
6,628
5,857
14,969
10,997
Net Interest Income
8,199
8,129
8,121
7,944
7,777
16,328
15,619
Provision for (recovery of) credit losses
(458
)
824
(134
)
620
539
366
539
Noninterest income
2,986
2,342
2,464
2,572
2,907
5,328
5,097
Noninterest expense
8,156
8,431
10,482
8,922
10,335
16,587
19,364
Income tax expense (benefit)
471
(1
)
(220
)
(44
)
(431
)
470
(483
)
Net Income
$
3,016
$
1,217
$
457
$
1,018
$
241
$
4,233
$
1,296
Per Share Data
Earnings per common share – basic
$
0.86
$
0.35
$
0.13
$
0.29
$
0.07
$
1.21
$
0.37
Book Value per Share
23.54
22.11
22.47
19.43
20.75
23.54
20.75
Tangible Book Value per Share (1)
22.62
21.20
21.55
18.50
19.82
22.62
19.82
Key Performance Ratios
Return on Average Assets
0.93
%
0.37
%
0.14
%
0.32
%
0.08
%
0.65
%
0.20
%
Return on Average Equity
15.59
%
6.25
%
2.49
%
5.80
%
1.33
%
10.96
%
3.62
%
Noninterest Income / Average Assets
0.92
%
0.71
%
0.76
%
0.80
%
0.92
%
0.82
%
0.80
%
Noninterest Expense / Average Assets
2.52
%
2.54
%
3.23
%
2.76
%
3.28
%
2.56
%
3.05
%
Efficiency Ratio (2)
71.23
%
78.67
%
96.79
%
82.81
%
94.35
%
74.77
%
91.14
%
Net Interest Margin
2.72
%
2.64
%
2.66
%
2.67
%
2.65
%
2.71
%
2.69
%
Earning Asset Yield
5.19
%
5.07
%
4.96
%
4.87
%
4.64
%
5.18
%
4.57
%
Cost of Interest Bearing Liabilities
3.21
%
3.14
%
3.00
%
2.87
%
2.61
%
3.17
%
2.51
%
Cost of Funds
2.51
%
2.45
%
2.37
%
2.26
%
1.75
%
2.49
%
1.91
%
Net Interest Spread
2.68
%
2.62
%
2.59
%
2.61
%
2.89
%
2.69
%
2.66
%
Net Charge-offs
$
179
$
807
$
770
$
193
$
344
$
986
$
510
Net Charge-offs as a % of Avg Loans
0.09
%
0.39
%
0.38
%
0.10
%
0.18
%
0.24
%
0.14
%
Non-Performing Loans
$
7,586
$
6,246
$
6,469
$
3,586
$
1,997
$
7,586
$
1,997
Non-Performing Loans to Total Assets
0.58
%
0.47
%
0.50
%
0.28
%
0.16
%
0.58
%
0.16
%
Non-Performing Assets
$
7,586
$
6,246
$
6,524
$
3,586
$
1,997
$
7,586
$
1,997
Non-Performing Assets to Total Assets
0.58
%
0.47
%
0.50
%
0.28
%
0.16
%
0.58
%
0.16
%
ACLL as a % of Total Loans
0.95
%
1.02
%
1.01
%
1.14
%
1.13
%
0.95
%
1.13
%
Loans to Deposits
69.72
%
71.42
%
72.54
%
71.05
%
68.27
%
69.72
%
68.27
%
(1) Tangible book value per share is calculated by subtracting goodwill and other intangibles from total shareholders’ equity and dividing the result by the common shares outstanding. Tangible book value per share is a non-GAAP financial measure that management believes provides investors with important information that may be related to the valuation of common stock.
(2) The Efficiency Ratio equals noninterest expenses divided by the sum of tax equivalent net interest income and noninterest income. Noninterest income excludes gains (losses) on securities transactions and low-income housing partnership losses. Noninterest expense excludes amortization of intangibles.
(3) Certain reclassifications have been made in the 2023 financial information to conform to reporting for the 2024. These reclassifications are not considered material and had no impact on prior year’s net income, balance sheet or shareholders’ equity.
FOR MORE INFORMATION, CONTACT
Lisa F. Campbell | EVP | Chief Financial Officer
540-896-1705 fmbankva.com
https://www.fmbankva.com/wp-content/uploads/2023/05/Executive-Team-2023-FINAL-e1684509203761.jpg9352000Jacob Mowry/wp-content/themes/fmbank-enfold-child/images/FandMBank_whitelogo.svgJacob Mowry2024-07-30 11:03:202025-05-22 17:19:05F&M BANK CORP. REPORTS SECOND QUARTER 2024 EARNINGS AND QUARTERLY DIVIDEND
F&M reports solid first quarter results, shows strong start in 2024.
See associated, unaudited summary consolidated financial data for additional information.
TIMBERVILLE, VA / ACCESSWIRE / April 30, 2024 / F&M Bank Corp. (the “Company” or “F&M”), (OTCQX:FMBM), the parent company of Farmers & Merchants Bank (“F&M Bank” or the “Bank”), today reported results for the quarter ended March 31, 2024.
Net income was $1.2 million or $0.35 per share for the quarter ended March 31, 2024, compared to $457,000 or $0.13 per share for the linked quarter ended December 31, 2023, and compared to $1.1 million or $0.30 per share for the prior year quarter ended March 31, 2023.
At March 31, 2024, the Company had total assets of $1.32 billion, total loans of $825.9 million, and total deposits of $1.16 billion, reflecting growth in first quarter 2024 of $3.8 million in total loans and $23.1 million in total deposits. Our loan portfolio consists of a mix of loan types, intended to hedge against risks associated with concentrations in any particular type of loan.
“On behalf of everyone at F&M, I am pleased to share our financial results for first quarter 2024,” said Mike Wilkerson, chief executive officer. “During the quarter, we achieved positive trends in these key areas: increased revenue, increased interest income, increased net income, reduced operational expenses, deposit and loan growth, and continued strong asset quality.
“These results are directly related to the execution of our strategic plan to position our Company for the future. During the remainder of 2024, we expect to benefit from several initiatives including: maturing bond investments that should be converted into higher yielding loans or bonds, an ongoing review of operational efficiency that focuses on providing exceptional customer experience, a revised compensation plan for our board of directors of 60% stock/40% cash, a focused initiative promoting dividend reinvestment, and local market investor presentations in the Shenandoah Valley.
“As I shared in our 2024 Annual Report, our number one priority is to generate “sufficient and sustainable profit” and everyone at F&M Bank is committed to this goal. It is exciting to see how our team has embraced this commitment, as shown in their desire to help determine our culture as a community bank. Our financial results are just one way we, our customers, shareholders, and the Shenandoah Valley, benefit from their knowledge and understanding of what community banking means.
“To our shareholders, from all of us at F&M Bank Corp., thank you for your investment, trust, and support. If you bank with us, your business is appreciated. Banking with us is one of the best ways for you to support your investment. If you do not bank with us yet, we invite you to visit any of our fourteen branch locations in the Shenandoah Valley.”
FIRST QUARTER INCOME STATEMENT REVIEW
Overview
Net income for first quarter 2024 was $1.2 million or $0.35 per share, compared to $1.1 million or $0.30 per share for first quarter 2023, and $457,000 or $0.13 per share for fourth quarter 2023, which included $1.1 million in after-tax severance expense related to a voluntary early retirement program.
Interest income for first quarter 2024 was $15.5 million, an increase of $2.5 million over first quarter 2023 and $363,000 over fourth quarter 2023, due to higher loan volume and higher interest rates. Higher rates on interest bearing deposits, specifically money market accounts and time deposits, coupled with interest paid on short-term borrowings, increased the Bank’s interest expense to $7.4 million for first quarter 2024, up $2.3 million from first quarter 2023 and up $413,000 over fourth quarter 2023.
During first quarter 2024, the Bank recorded an $823,000 provision for credit losses compared to no provision in first quarter 2023 and a recovery of credit losses of $134,000 in fourth quarter 2023. The current quarter provision was the result of net loan charge-offs of $807,000, and minimal changes to the economic, credit quality, and collateral dependent qualitative factors used in the Bank’s Allowance for Credit Losses on Loans (“ACLL”) model. The provision also included a recovery of $70,000 in the reserve for unfunded commitments that resulted from a decline in outstanding loan commitments. At March 31, 2024, the ACLL totaled $8.4 million or 1.02% of gross loans outstanding.
Net Interest Income
For first quarter 2024, net interest income totaled $8.1 million, a decrease of $50,000 from fourth quarter 2023, as a $413,000 increase in interest expense outpaced the $363,000 increase in interest income. The increase in interest expense is due to higher average balances and interest rates on interest-bearing deposits and short-term debt. Interest income benefited from higher average loan balances and higher loan yields from new originations and adjustable rate loans. The Bank’s net interest margin decreased by two basis points to 2.64% on a linked quarter basis.
Compared to first quarter 2023, net interest income increased by $244,000, while our net interest margin decreased by twelve basis points. Interest income and fees on loans for first quarter 2024 were $2.5 million higher than the same quarter last year due to higher rates on adjustable rate loans and loan growth of $69.0 million since March 31, 2023. Interest expense grew by $2.3 million from the same quarter last year due to higher interest rates on deposits and rates paid on short term FHLB advances, as well as higher average balances on interest-bearing deposits and short-term debt. Since last March, we have seen a shift from noninterest-bearing demand deposits to interest-bearing deposits, with noninterest-bearing deposits declining by $17.0 million and interest-bearing deposits increasing by $68.1 million.
Noninterest Income
Noninterest income, which includes gains and losses, totaled $2.4 million for first quarter 2024, a decrease of $73,000 from fourth quarter 2023, which included a $232,000 milestone gain from the 2022 sale of the Company’s partnership interest in Infinex. Several categories of noninterest income increased on a linked quarter basis. Investment services and insurance income increased by $85,000, mortgage banking income increased by $34,000 and title insurance income increased by $38,000. The other categories of noninterest income combined to increase noninterest income by $2,000.
Compared to first quarter 2023, noninterest income increased by $25,000. The increase resulted from increases of $48,000 in service charges on deposit accounts, $74,000 in investment services and insurance income, $55,000 in title insurance income and $36,000 in ATM and check card fees. There were decreases of $152,000 in mortgage banking income and $47,000 in other operating income. Other smaller year over year changes netted to increase noninterest income by another $11,000.
Noninterest Expenses
Noninterest expenses totaled $8.4 million for first quarter 2024, compared to $10.5 million in fourth quarter 2023, a decrease of $2.1 million, led by a decrease in salary and employee benefits expenses. During fourth quarter 2023, the Bank accrued $1.4 million in pre-tax expenses related to a voluntary early exit plan for employees that impacted these expense categories. As a result, salary expense declined by $1.5 million on a linked quarter basis. Employee benefits expense also declined by $201,000 due to a combination of the voluntary early exit plan and a refund of $162,000 received in March 2024 due to better than projected group health insurance claims in 2023. Other operating expenses declined by $290,000. There were other changes in noninterest expense categories that combined to decrease total noninterest expenses by $30,000.
Compared to the same quarter in 2023, noninterest expenses declined $766,000. As a result of the voluntary early exit plan, salary expense declined by $562,000. Employee benefits expense declined by $177,000 due to the combination of factors mentioned above. There were other changes in noninterest expense categories that combined to decrease total noninterest expenses by $27,000.
BALANCE SHEET REVIEW
On March 31, 2024, assets totaled $1.32 billion, an increase of $21.6 million over December 31, 2023. Total loans increased by $3.8 million to $825.9 million, including increases of $5.6 million in 1-to-4 family adjustable rate mortgage loans, $1.8 million in home equity lines of credit, $2.3 million in agricultural loans, $4.8 million in construction loans and $4.4 million in commercial and industrial loans. These increases were offset by decreases of $3.1 million in dealer finance loans and $10.9 million in commercial real estate loans.
Investment securities decreased by $9.8 million due to paydowns on U.S. Agency mortgage-backed securities and expected bond maturities, combined with an increase in the unrealized loss on the bond portfolio. During first quarter, the unrealized loss increased by $1.3 million to $41.5 million from $40.2 million at December 31, 2023.
Total deposits on March 31, 2024, were $1.16 billion, an increase of $23.1 million from the end of 2023, due to growth of $2.9 million in noninterest-bearing demand deposits and $20.3 million in interest-bearing deposits, specifically time deposits. At March 31, 2024, 11.09% of the Bank’s total deposits were uninsured.
Shareholders’ equity decreased by $589,000 to $77.7 million due to an increase of $1.0 million in the accumulated other comprehensive loss associated with the unrealized loss on available for sale investment securities and a $905,000 dividend to shareholders. These decreases were offset by $109,000 in shares issued, and net income of $1.2 million. Tangible book value per common share has decreased to $21.201 from $21.551 at December 31, 2023. Tangible book value per common share is a non-GAAP financial measure. Further information can be found under the heading “Non-GAAP Financial Measures” and in the footnotes to the table accompanying this release.
LIQUIDITY
The Company’s on-balance sheet asset liquidity includes cash and cash equivalents, unpledged investment securities, and loans held for sale, which totaled $179.6 million at March 31, 2024, up from $178.0 million at December 31, 2023. In 2023, the Bank pledged investment securities with a par value totaling $220.8 million to the Federal Reserve System’s Bank Term Funding Program (BTFP). In March 2023, the Board of Governors of the Federal Reserve System established the BTFP to provide any U.S. federally insured depository institution, including the Bank, with a line of credit equal to the par value of securities pledged to the BTFP. Advances from the BTFP could be requested by the Bank for up to one year until March 31, 2024. The Bank also pledged securities with a market value of $19.5 million to the Federal Reserve Discount Window in 2023. The BTFP expired on March 11, 2024.
The Bank has access to off-balance sheet liquidity through unsecured Federal funds lines totaling $90.0 million at March 31, 2024, and December 31, 2023. The Bank has a secured line of credit with the Federal Home Loan Bank (FHLB) with available credit of $104.8 million as of March 31, 2024, and $90.1 million as of December 31, 2023. The FHLB line of credit is secured by a blanket lien on qualifying loans in the residential, commercial, agricultural real estate, and home equity portfolios.
The Bank is scheduled to receive $84.2 million from bond paydowns and maturities by the end of 2024 which can be used to fund future loan growth and for other purposes.
LOAN PORTFOLIO
The Company’s loan portfolio is diversified with its two largest segments being residential mortgage loans originated through its subsidiary F&M Mortgage, and automobile loans originated by its dealer finance division. Following is a breakdown of the loan portfolio composition as of March 31, 2024, and December 31, 2023 (dollars in thousands):
March 31, 2024
December 31, 2023
Loan Category
Balance
Percentage of Total Portfolio
Balance
Percentage of Total Portfolio
Residential mortgage
$
209,147
25.32
%
$
204,344
24.86
%
Automobile
119,785
14.50
%
122,924
14.95
%
Non owner-occupied commercial real estate
101,237
12.26
%
106,181
12.92
%
Owner-occupied commercial real estate
88,660
10.74
%
92,362
11.23
%
Secured by farmland
82,048
9.93
%
81,657
9.93
%
Commercial and industrial (includes agricultural loans)
61,451
7.44
%
58,734
7.14
%
Other construction and loan development loans
52,812
6.39
%
47,749
5.81
%
Home equity lines of credit
46,087
5.58
%
45,749
5.56
%
Residential construction loans
32,397
3.92
%
30,488
3.71
%
Credit card and other consumer loans
16,354
1.98
%
17,278
2.10
%
Multi-family
10,699
1.30
%
8,203
1.00
%
Other
5,195
0.64
%
6,423
0.79
%
Total
$
825,872
100.00
%
$
822,092
100.00
%
ASSET QUALITY AND ALLOWANCE FOR CREDIT LOSSES
Nonperforming loans (NPLs) as a percentage of total assets were 0.47% at March 31, 2024, compared to 0.50% at December 31, 2023. Net charge-offs as a percentage of average loans were 0.39% for the quarter ended March 31, 2024, up .01% from the linked quarter December 31, 2023, and up 0.30% from first quarter 2023.
The Bank recorded a provision for credit losses of $823,000 in first quarter 2024, compared to a recovery of loans losses of $134,000 in fourth quarter 2023 and no provision for credit losses in first quarter 2023. The provision was the result of net loan charge-offs of $807,000, loan growth of $3.8 million and minimal changes to qualitative factors. The ACLL was $8.4 million at March 31, 2024, up $87,000 from December 31, 2023. The ACLL as a percentage of total loans was 1.02% at March 31, 2024, compared to 1.01% at December 31, 2023. The reserve for unfunded commitments decreased from $690,0000 at December 31, 2023 to $620,000 at March 31, 2024 due to decreases of $3.5 million in commitments for 1-4 family construction, $1.4 million in commercial construction, $3.9 million in commercial and industrial construction loans which were offset by an increase of $3.3 million in commitments for owner occupied commercial real estate.
DIVIDEND DECLARATION
On April 18, 2024, our Board of Directors declared a first quarter dividend of $0.26 per share to common shareholders. Based on our most recent trade price of $15.40 per share, this constitutes a 6.75% yield on an annualized basis. The dividend will be paid on May 30, 2024, to shareholders of record as of May 15, 2024.
###
ABOUT US
F&M Bank Corp. is an independent, locally owned, financial holding company offering a full range of financial services through our subsidiary, Farmers & Merchants Bank’s (F&M Bank) fourteen banking offices in Rockingham, Shenandoah, and Augusta counties, Virginia, and the cities of Winchester and Waynesboro, Virginia. The Company also owns F&M Mortgage, a mortgage lending subsidiary, and VSTitle, a title company subsidiary. Founded in 1908 as a community venture to serve the farmers and merchants of the Shenandoah Valley, where both the Company and the Bank are headquartered, F&M Bank remains more committed than ever to the success of the agricultural industry, small business ventures, and the nonprofit sector.F&M’s values, which are gregarious, resolute, original, and wholehearted (G.R.O.W.), combined with our brand pillars of sustenance, security, and enrichment, shape the Company’s decision-making, philanthropy, and volunteerism. The only publicly traded organization based in Rockingham County, we offer a diverse suite of financial products and services and a strong team dedicated to living our mission of being the financial partner of choice in the Shenandoah Valley, both today and tomorrow, as we have been since 1908. Additional information may be found by visiting our website, fmbankva.com.
NON-GAAP FINANCIAL MEASURES
The accounting and reporting policies of the Company conform to U.S. generally accepted accounting principles (“GAAP”) and prevailing practices in the banking industry. However, management uses certain non-GAAP measures, including tangible common equity and tangible book value per share, to supplement the evaluation of the Company’s financial condition and performance. Management believes presentation of these non-GAAP financial measures provides useful supplemental information that is essential to a proper understanding of the Company’s operating results. These non-GAAP disclosures should not be viewed as a substitute for operating results determined in accordance with GAAP, nor are they necessarily comparable to non-GAAP performance measures that may be presented by other companies. A definition of GAAP to non-GAAP measures is included in the footnotes to table accompanying this release.
FORWARD-LOOKING STATEMENTS
This press release may contain “forward-looking statements” as defined by federal securities laws, which are subject to significant risks and uncertainties. These include statements regarding future plans, strategies, results, or expectations that are not historical facts, and are generally identified by the use of words such as “believe,” “expect,” “intend,” “anticipate,” “will,” “estimate,” “project” or similar expressions. These statements are based on estimates and assumptions, and our ability to predict results, or the actual effect of future plans or strategies, is inherently uncertain. Our actual results could differ materially from those contemplated by these forward-looking statements. Factors that could have a material adverse effect on our operations and future prospects include, but are not limited to, changes in local and national economies or market conditions; changes in interest rates; regulations and accounting principles; changes in policies or guidelines; loan demand and asset quality, including values of real estate and other collateral; deposit flow; the impact of competition from traditional or new sources; and other factors. Readers should consider these risks and uncertainties in evaluating forward-looking statements and should not place undue reliance on such statements. We undertake no obligation to update these statements following the date of this press release.
F&M Bank Corp. Summary Consolidated Financial Data (unaudited) Dollars in Thousands, except for per share data
Quarter to Date
3/31/2024
12/31/2023 (3)
9/30/2023 (3)
6/30/2023 (3)
3/31/2023 (3)
Condensed Balance Sheet
Cash and cash equivalents
$
52,486
$
23,717
$
22,159
$
36,505
$
31,273
Investment securities
369,744
379,557
383,502
394,868
398,960
Loans held for sale
1,385
1,119
2,028
881
1,242
Gross loans
825,872
822,092
805,602
776,260
756,920
Allowance for credit losses
(8,408
)
(8,321
)
(9,166
)
(8,769
)
(8,546
)
Goodwill
3,082
3,082
3,082
3,082
3,082
Other assets
72,053
73,350
75,212
75,543
69,944
Total Assets
$
1,316,214
$
1,294,596
$
1,282,419
$
1,278,370
$
1,252,875
Noninterest bearing deposits
$
267,106
$
264,254
$
277,219
$
277,578
$
284,060
Interest bearing deposits
889,237
868,982
856,691
859,534
821,175
Total Deposits
1,156,343
1,133,236
1,133,910
1,137,112
1,105,235
Short-term debt
60,000
60,000
60,000
47,000
55,000
Long-term debt
6,943
6,932
6,922
6,911
6,901
Other liabilities
15,194
16,105
14,567
15,153
13,104
Total Liabilities
1,238,480
1,216,273
1,215,399
1,206,176
1,180,240
Shareholders’ equity
77,734
78,323
67,020
72,194
72,635
Total Liabilities and Shareholders’ Equity
$
1,316,214
$
1,294,596
$
1,282,419
$
1,278,370
$
1,252,875
Condensed Income Statement
Interest income and fees on loans
$
13,352
$
13,061
$
12,525
$
11,517
$
10,854
Interest income and fees on loans held for sale
17
22
19
25
22
Income on cash and securities
2,151
2,074
2,028
2,082
2,097
Total Interest Income
15,520
15,157
14,572
13,624
12,973
Interest expense on deposits
6,337
6,108
5,811
5,216
4,042
Interest expense on short-term debt
996
812
702
523
992
Interest expense on long-term debt
116
116
115
116
112
Total Interest Expense
7,449
7,036
6,628
5,855
5,146
Net Interest Income
8,071
8,121
7,944
7,769
7,827
Provision for (recovery of) credit losses
823
(134
)
620
539
–
Noninterest income
2,391
2,464
2,572
2,752
2,366
Noninterest expense
8,423
10,482
8,922
10,172
9,189
Income tax benefit
(1
)
(220
)
(44
)
(431
)
(51
)
Net Income
$
1,217
$
457
$
1,018
$
241
$
1,055
Per Share Data
Earnings per common share – basic
$
0.35
$
0.13
$
0.29
$
0.07
$
0.30
Book Value per Share
22.11
22.47
19.43
20.75
20.86
Tangible Book Value per Share (1)
21.20
21.55
18.50
19.82
19.93
Key Performance Ratios
Return on Average Assets
0.37
%
0.14
%
0.32
%
0.08
%
0.34
%
Return on Average Equity
6.24
%
2.49
%
5.80
%
1.33
%
5.97
%
Noninterest Income / Average Assets
0.72
%
0.76
%
0.80
%
0.87
%
0.77
%
Noninterest Expense / Average Assets
2.53
%
3.23
%
2.76
%
3.22
%
2.98
%
Efficiency Ratio (2)
78.67
%
96.79
%
82.81
%
94.43
%
87.95
%
Net Interest Margin
2.64
%
2.66
%
2.67
%
2.66
%
2.76
%
Earning Asset Yield
5.07
%
4.96
%
4.87
%
4.65
%
4.57
%
Cost of Interest Bearing Liabilities
3.14
%
3.00
%
2.87
%
2.61
%
2.40
%
Cost of Funds
2.45
%
2.37
%
2.26
%
2.04
%
1.83
%
Net Interest Spread
2.62
%
2.59
%
2.61
%
2.61
%
2.74
%
Net Charge-offs
$
807
$
770
$
193
$
344
$
166
Net Charge-offs as a % of Avg Loans
0.39
%
0.38
%
0.10
%
0.18
%
0.09
%
Non-Performing Loans
$
6,246
$
6,469
$
3,586
$
1,997
$
1,782
Non-Performing Loans to Total Assets
0.47
%
0.50
%
0.28
%
0.16
%
0.14
%
Non-Performing Assets
$
6,246
$
6,524
$
3,586
$
1,997
$
1,782
Non-Performing Assets to Total Assets
0.47
%
0.50
%
0.28
%
0.16
%
0.14
%
ACLL as a % of Total Loans
1.02
%
1.01
%
1.14
%
1.13
%
1.13
%
Loans to Deposits
71.42
%
72.54
%
71.05
%
68.27
%
68.48
%
(1) Tangible book value per share is calculated by subtracting goodwill and other intangibles from total shareholders’ equity and dividing the result by the common shares outstanding. Tangible book value per share is a non-GAAP financial measure that management believes provides investors with important information that may be related to the valuation of common stock.
(2) The Efficiency Ratio equals noninterest expenses divided by the sum of tax equivalent net interest income and noninterest income. Noninterest income excludes gains (losses) on securities transactions and low-income housing partnership losses. Noninterest expense excludes amortization of intangibles.
(3) Certain reclassifications have been made in the 2023 financial information to conform to reporting for the 2024 presentation. These reclassifications are not considered material and had no impact on prior year’s net income, balance sheet or shareholders’ equity.
FOR MORE INFORMATION, CONTACT
Lisa F. Campbell | EVP | Chief Financial Officer
540-896-1705 fmbankva.com
https://www.fmbankva.com/wp-content/uploads/2023/05/Executive-Team-2023-FINAL-e1684509203761.jpg9352000Holly Thorne/wp-content/themes/fmbank-enfold-child/images/FandMBank_whitelogo.svgHolly Thorne2024-05-02 14:56:542025-05-22 17:20:22F&M Bank Corp. Reports First Quarter 2024 Earnings and Quarterly Dividend
TIMBERVILLE, VA / April 9, 2024 / F&M Bank Corp. (the “Company” or “F&M”), (OTCQX:FMBM), the parent company of Farmers & Merchants Bank (“F&M Bank” or the “Bank”) Announces Renewed Merchant Services Partnership with Celero Commerce, a High-Tech, High-Touch Payment Solutioning Firm Timberville, Virginia, April 9, 2024.
F&M Bank, the financial partner of choice in the Shenandoah Valley, is thrilled to announce its renewed partnership with Celero Commerce, a renowned High-Tech, High-Touch Payment Solutioning firm. This renewal marks a significant milestone in F&M Bank’s commitment to delivering exceptional banking experiences to its business clients.
Going forward F&M Bank is also pleased that Jacqueline Porthouse will be its new merchant services consultant. Jacqueline has a wealth of experience and expertise in building custom solutions for business clients. Her support will further strengthen F&M Bank’s ability to provide cutting-edge payment solutions and exceptional service to its valued customers.
F&M Bank aims to elevate the banking experience for its business clients by offering a white glove service with a top-of-the-line merchant program. By leveraging Celero’s state-of-the-art payment solutioning technology F&M Bank’s clients from healthcare providers, restaurants, non-profits, and more can expect a seamless and secure payment processing experience. This renewal also positions F&M Bank to fully support businesses that want to utilize online and point-of-sale transactions regardless of volume.
“We are excited to renew our relationship with Celero and work with Jacqueline Porthouse” said Mike Wilkerson, F&M Bank CEO. “This collaboration allows us to deliver an unparalleled banking experience to our business clients, providing them with the highest level of service and access to a world-class merchant program.”
Porthouse also expressed enthusiasm about the partnership, stating, “I am delighted to begin working with the F&M Bank team. By combining Celero’s advanced payment solutioning capabilities with F&M Bank’s proven exceptional banking services, we are confident in our ability to deliver a truly remarkable experience to business clients.”
About F&M Bank:
F&M Bank Corp. (OTCQX: FMBM) proudly remains the only publicly traded organization based in Rockingham County, VA, and since 1908, has served the Shenandoah Valley through its banking subsidiary F&M Bank, with full-service branches and a wide variety of financial services, including home loans through F&M Mortgage, and real estate settlement services and title insurance through VSTitle. Both individuals and businesses find the organization’s local decision-making and up-to-date technology provide the kind of responsive, knowledgeable, and reliable service that only a progressive community bank can. F&M Bank has grown to $1 billion in assets with over 175 full and part-time employees. Its conservative approach to finances and sound investments, along with excellent customer service, has made F&M Bank profitable and continues to pave the way for a bright future.
Headquartered in Nashville, Celero Commerce is a full-service, integrated electronic commerce solutions provider powered by leading-edge technology, strategic partnerships, and business intelligence. Celero offers small and medium-sized businesses payment processing services, business management software, and data intelligence, empowering them to drive growth and profitability. Visit https://www.celerocommerce.com/ to learn more.
As our local fire and rescue departments battle against the raging fires that threaten our communities, it is crucial that we stand united and extend a helping hand. These brave men and women are working around the clock, risking their lives to contain the flames and protect lives and property.
F&M Bank has always prioritized supporting our local first responders and is committed to doing our part to donate to those who protect our communities. Together, we can make a difference and ensure that our local fire and rescue departments have the necessary support to combat these fires effectively. Remember, even the smallest contribution can make a significant impact. Whether it’s donating supplies, giving financial assistance, or spreading awareness, every act of support counts.
Listed below are links and contact information for various organizations that are actively seeking supplies or monetary donations. If there is an organization not listed that you know is in need of assistance, please email marketing@fmbankva.com with donation details.
Learn how you can get involved with local departments in need below:
Bergton Fire Department
Bergton Fire Department is accepting food supplies such as water, Gatorade, peanut butter, crackers, snack foods, and other non-perishables. Hygiene necessities such as baby wipes are also very helpful. These supplies or monetary donations can be either dropped off at or mailed to 18140 Crab Run Rd, Bergton, VA 22811.
Broadway Volunteer Fire Department is accepting food supplies such as water, Gatorade, peanut butter, crackers, snack foods and other non-perishables. Hygiene necessities such as baby wipes are also very helpful. These supplies or monetary donations can be either dropped off at or mailed to 117 N Central St, Broadway, VA 22815.
Clover Hill Volunteer Fire Co. does not currently need material donations. However, monetary donations to replenish its funds can be mailed to 2100 Clover Hill Rd, Dayton, VA 22821. Donations can also be made on its website: www.cloverhillfd.com
New Market Fire & Rescue is asking for donations of water, Gatorade, peanut butter, crackers, snack foods, and non-perishables. They are also in need of baby wipes. Donations can be delivered to their station at 9771 S Congress St, New Market, VA 22844.
Donations of food, medical supplies, hygiene necessities, or monetary donations can be dropped off at the Port Republic Road Emergency Response Station at 2654 Port Republic Rd, Harrisonburg, VA 22801.
SCD Fire & Rescue is not currently in need of material donations. If you wish to contribute monetarily, please contact Stacy McFarland with the American Red Cross at: 681-247-9472
TIMBERVILLE, VA / ACCESSWIRE / January 29, 2024 / F&M Bank Corp. (the “Company” or “F&M”), (OTCQX:FMBM), the parent company of Farmers & Merchants Bank (“F&M Bank” or the “Bank”) today reported results for the quarter and year ended December 31, 2023.
Net income was $457,000 or $0.13 per share for the quarter ended December 31, 2023, compared to $1.0 million or $0.29 per share for the linked quarter ended September 30, 2023, and compared to $1.7 million or $0.49 per share for the prior year quarter ended December 31, 2022. For the year ended December 31, 2023, net income was $2.8 million or $0.79 per share, which includes $1.8 million in after-tax, one-time expenses. These one-time expenses, which are intended to drive cost savings in future periods, include severance accruals for former bank officers that occurred in the first half of 2023 and expenses related to a voluntary early exit plan announced in the fourth quarter. By comparison, the Company earned $8.3 million or $2.41 per share in 2022.
At December 31, 2023, the Company had total assets of $1.29 billion, total loans of $822.1 million, and total deposits of $1.13 billion. This reflects growth of $78.5 million in total loans and $49.9 million in total deposits since the end of 2022. Our loan portfolio consists of a solid mix of loan types, which we believe provides a hedge against risks associated with concentrations in any particular type of loan.
“I believe in the years ahead-and even now-we can point to April 2023 as a new beginning for F&M,” said Mike Wilkerson, chief executive officer. “As a leadership team, we fully agreed then that our goal is to ensure the long-term good health and future of F&M Bank, or as we like to say, ‘the next 115 years.’ Every decision we make has, and will continue to, reflect this commitment.
“To that end, we developed and are executing a multi-year strategic plan focused on growing profitability and capital and managing asset growth and liquidity in a manner that should improve return on investment to our shareholders. A key part of this plan involved assessing our Company and all of its business lines, making changes designed to improve our organizational effectiveness, enhance opportunities to generate revenue, and control and reduce expenses. Progress is already being made, and that progress is reflected in this financial report.
“Our industry faced significant challenges over the past few years and will continue to face challenges, as it always has. Our goal is to be prepared to meet whatever challenges and the best way to be prepared is on a foundation of profitability. We have a great bank and serve a diverse and dynamic market in Virginia’s Shenandoah Valley. Along with everyone on our management team, I am excited about the future.”
FOURTH QUARTER INCOME STATEMENT REVIEW
Overview
Net income for fourth quarter 2023 was $457,000 or $0.13 per share, compared to $1.0 million or $0.29 per share for third quarter 2023, and $1.7 million or $0.49 per share for fourth quarter 2022. This quarter’s net income includes $1.1 million in after-tax severance expense related to a voluntary early retirement program.
Interest income for fourth quarter 2023, was $15.2 million, an increase of $585,000 over third quarter 2023 and $3.1 million over the prior year fourth quarter, due to higher loan volume and higher interest rates. Higher rates on interest bearing deposits, specifically money market accounts and time deposits, coupled with interest paid on short-term borrowings, increased the Bank’s interest expense to $7.0 million for fourth quarter 2023, up $408,000 from third quarter 2023 and up $3.7 million over fourth quarter 2022.
During fourth quarter 2023, the Bank recorded a $134,000 recovery of credit losses compared to provisions of $620,000 in third quarter 2023, and $716,000 in fourth quarter 2022. The recovery was the result of improvements in the economic, credit quality and collateral dependent qualitative factors across several segments of the loan portfolio. At December 31, 2023, the Allowance for Credit Losses (ACL) totaled $8.3 million or 1.01% of gross loans outstanding.
Net Interest Income
For fourth quarter 2023, net interest income totaled $8.1 million, an increase of $177,000 from third quarter 2023, as the $585,000 increase in interest income outpaced the $408,000 increase in interest expense. Interest income benefited from higher average loan balances and higher loan yields from new originations and adjustable rate loans. The increase in interest expense is due to higher average balances and, interest rates on interest-bearing deposits and short-term debt. The Bank’s net interest margin decreased by one basis point to 2.66% on a linked quarter basis.
Compared to fourth quarter 2022, net interest income declined by $583,000, and our net interest margin decreased by 38 basis points. Interest income and fees on loans were $3.2 million higher than the same quarter last year due to higher rates on adjustable rate loans and $78.5 million in loan growth since December 31, 2022. Interest expense grew by $3.7 million from the same quarter last year due to higher interest rates on deposits and rates paid on short term FHLB advances, as well as higher average balances on interest-bearing deposits and short-term debt. Since last December, we have seen a shift from noninterest bearing demand deposits to interest-bearing deposits, with noninterest bearing deposits declining by $29.3 million and interest-bearing deposits increasing by $79.2 million.
Noninterest Income
Noninterest income, which includes gains and losses, totaled $2.5 million for fourth quarter 2023, which was a decrease of $108,000 from third quarter 2023. During the fourth quarter, the Company received a $232,000 milestone gain from the 2022 sale of its partnership interest in Infinex. In addition, there was a $122,000 quarter-over-quarter increase in investment services and insurance income. Offsetting these increases were declines in mortgage banking income of $182,000 and title insurance income of $179,000.
Compared to fourth quarter 2022, noninterest income declined by $986,000 to $2.5 million. In fourth quarter 2022, the Company reported a $3.8 million gain from the sale of its partnership interest in Infinex and $2.8 million in losses from the sale of bonds. In fourth quarter 2023, there was a smaller milestone gain of $232,000 received related to the Infinex sale. The net effect of the change in gains and losses was a decrease of $701,000 in noninterest income. Other changes in noninterest income include a $48,000 increase in service charges on deposit accounts, $44,000 increase in investment services and insurance income, and a $26,000 increase in ATM and check card fees. There were decreases of $23,000 in mortgage banking income, $98,000 in title insurance income, and $185,000 in other operating income.
Noninterest Expenses
Noninterest expenses totaled $10.5 million for fourth quarter 2023, compared to $8.9 million in third quarter, an increase of $1.6 million on a linked-quarter basis, led by an increase in salary and employee benefits expenses. In fourth quarter, the Bank accrued $1.4 million in pre-tax expenses related to a voluntary early exit plan that impacted these expense categories. Also contributing to the increase in noninterest expense was an increase in legal and professional fees expense of $106,000, an increase in telecommunications and data processing expense of $98,000, and an increase in other operating expenses totaling $230,000. There was a decrease of $163,000 in equipment expense and smaller fluctuations in other expense categories that combined to increase $21,000 from last quarter.
Compared to the same quarter in 2022, noninterest expenses increased $941,000, driven by the aforementioned increase in salary expense. Other significant increases were $177,000 in FDIC insurance expense and $246,000 in other operating expenses. Offsetting these increases were declines of $117,000 in marketing expenses, $205,000 in legal and professional expenses and $118,000 in telecommunications and data processing expenses. There were smaller fluctuations in other expense categories that netted to a decrease of $83,000 from fourth quarter 2022.
YEAR-TO-DATE INCOME STATEMENT REVIEW
Overview
Net income for the year ended December 31, 2023, was $2.8 million or $0.79 per share, compared to $8.3 million or $2.41 per share for the same period in 2022. During 2023, there were severance accruals for two former bank officers and for the voluntary early retirement program totaling $1.8 million in after-tax, one-time expenses. Interest income for 2023 was $56.3 million, an increase of $14.2 million over 2022, due to growth in the loan portfolio and higher interest rates. Higher rates on interest bearing deposits, specifically money market accounts and time deposits, coupled with interest paid on short-term borrowings, increased the Bank’s interest expense to $24.7 million, up $17.4 million from the year ended December 31, 2022.
In 2023, the Bank recorded a $1.0 million provision for credit losses compared to $866,000 for the same period in 2022. A provision is a charge to earnings to reserve for expected potential future credit losses.
Net Interest Income
In 2022 and 2023, short term interest rates rose significantly due to eleven Federal Reserve interest rate hikes totaling 525 basis points. This directly impacted the Bank’s cost of deposits and short-term borrowings, while the longer-term rates used to price loans have not increased to the same extent. For the year 2023, net interest income totaled $31.7 million, a decrease of $3.2 million from 2022, as a $14.2 million increase in interest income was outpaced by a $17.4 million increase in interest expense. Comparing the two years, higher loan interest income boosted the earning asset yield by 126 basis points to 4.74% while the cost of funds increased by 184 basis points resulting in a decrease in net interest margin of 36 basis points to 2.67%.
Noninterest Income
Noninterest income, including gains and losses, totaled $10.2 million for the year ended December 31, 2023, which was a decrease of $1.1 million from the year ended December 31, 2022. The primary reasons for this decrease were reductions of $33,000 in service charges on deposit accounts, $1.1 million in mortgage banking income, and $244,000 in title insurance income. The declines in mortgage banking and title insurance income are due to the overall decrease in mortgage banking volume and a shift from loans being sold on the secondary market to portfolio adjustable rate mortgages (ARMs) and construction products. These decreases were partially offset by a $459,000 increase in income from BOLI resulting from a one-time gain received in the second quarter, an increase of $260,000 in investment services and insurance income, higher ATM and check card fees which grew by $174,000, and a $2,000 increase in other operating income. In 2022, there was a $2.9 million loss on the sale of investment securities compared to no loss in 2023. Also in 2022, the Company sold its partnership interest in Infinex, resulting in a $3.8 million gain in 2022 and a second smaller milestone gain of $232,000 in December 2023.
Noninterest Expenses
Noninterest expenses totaled $38.8 million in 2023, compared to $36.5 million in 2022, an increase of $2.2 million. A primary driver for this increase was the $2.3 million in pre-tax severance expenses related to the voluntary early exit plan accrued in the fourth quarter and severance accruals for two former executives earlier in 2023. These accruals contributed to the $1.9 million increase in salary expense to $18.9 million. Other significant year-over-year increases include higher equipment expense which increased $252,000, FDIC Insurance expense which increased $226,000, legal and professional fees which were $85,000 higher than last year, and higher other operating expenses, which were up $853,000. These higher expenses were partially offset by decreases in employee benefits expense and telecommunications and data processing expenses which were down $676,000 and $253,000, respectively, as well as smaller decreases in other expense categories.
BALANCE SHEET REVIEW
On December 31, 2023, assets totaled $1.29 billion, an increase of $48.7 million over December 31, 2022. Total loans increased by $78.5 million to $822.1 million, including increases of $45.5 million in 1-to-4 family adjustable rate mortgage loans, $13.5 million in dealer financing loans, $8.5 million in commercial construction loans, and $10.4 million in agricultural loans. Investment securities decreased by $24.0 million due to paydowns on U.S. Agency mortgage-backed securities and expected bond maturities that were partially offset by an improvement in the unrealized loss on the bond portfolio. During 2023, the unrealized loss declined by $10.0 million to $40.2 million from $51.2 million at December 31, 2022.
Total deposits on December 31, 2023, were $1.13 billion, an increase of $49.9 million from the end of 2022, as the Bank was able to attract deposits by offering higher rates on money market and time deposit accounts, and by opening insured cash sweep accounts for new and existing customers. The additional deposits allowed us to reduce Federal Home Loan Bank (FHLB) advances by $10.0 million. At December 31, 2023, 11.60% of the Bank’s total deposits were uninsured.
Shareholders’ equity increased by $7.5 million to $78.3 million due to $580,000 in shares issued, an improvement of $8.7 million in the accumulated other comprehensive loss associated with the unrealized loss on available for sale investment securities and $318,000 associated with the pension liability, and net income of $2.8 million. These increases were offset by a $1.2 million adjustment to retained earnings upon the adoption of the Current Expected Credit Loss (CECL) accounting standard on January 1, 2023, and dividends to shareholders of $3.6 million. Tangible book value per common share has increased to $21.551 from $19.551 at December 31, 2022. Tangible book value per common share is a non-GAAP financial measure. Further information can be found under the heading “Non-GAAP Financial Measures” and in the footnotes to the table accompanying this release.
LIQUIDITY
The Company’s on-balance sheet asset liquidity includes cash and cash equivalents, unpledged investment securities, and loans held for sale, which totaled $178.0 million at December 31, 2023, down from $439.9 million at December 31, 2022. In 2023 the Bank pledged investment securities with a par value totaling $220.8 million to the Federal Reserve System’s Bank Term Funding Program (BTFP). In March 2023, the Board of Governors of the Federal Reserve System established the BTFP to provide any U.S. federally insured depository institution, including the Bank, with a line of credit equal to the par value of securities pledged to the BTFP. Advances from the BTFP may be requested by the Bank for up to one year until March 31, 2024. The Bank also pledged securities with a market value of $19.5 million to the Federal Reserve Discount Window. The Bank did not borrow from the BTFP or the Federal Reserve Discount Window during 2023.
In addition to the BTFP, the Bank has access to off-balance sheet liquidity through unsecured Federal funds lines totaling $90.0 million December 31, 2023, and December 31, 2022. The Bank also has a secured line of credit with the FHLB with available credit of $90.1 million and $39.1 million as of December 31, 2023, and December 31, 2022, respectively. The FHLB line of credit is secured by a blanket lien on qualifying loans in the residential, commercial, agricultural real estate, and home equity portfolios.
The Bank is scheduled to receive $93.7 million from bond paydowns and maturities by the end of 2024 which can be used to fund future loan growth and for other purposes.
LOAN PORTFOLIO
The Company’s loan portfolio is diversified with its two largest segments being residential mortgage loans originated through its subsidiary F&M Mortgage, and automobile loans originated by its dealer finance division.
Loan Category
Balance as of December 31, 2023 (in thousands)
Percentage of Total Portfolio
Residential mortgage loans
$204,344
24.86
%
Automobile loans
122,924
14.95
%
Non owner-occupied commercial real estate
106,181
12.92
%
Owner-occupied commercial real estate
92,362
11.23
%
Secured by farmland
81,657
9.93
%
Commercial and industrial (includes Agriculture Loans)
58,734
7.14
%
Home equity lines of credit
45,749
5.57
%
Other construction and land development loans
47,749
5.81
%
Residential construction loans
30,488
3.71
%
Credit card and other consumer loans
17,278
2.10
%
Multi-family
8,203
1.00
%
Other loans
6,423
0.78
%
Total
$822,092
100.00
%
ASSET QUALITY AND ALLOWANCE FOR CREDIT LOSSES
Nonperforming loans (NPLs) as a percentage of total assets were 0.50% at December 31, 2023, compared to 0.18% at December 31, 2022. Net charge-offs as a percentage of average loans were 0.38% for the quarter ended December 31, 2023, up from 0.16% for fourth quarter 2022. For the year ended December 31, 2023, the net charge off percentage was 0.19%, up from 0.10% in 2022.
The Bank recorded a recovery of credit losses of $134,000 in fourth quarter 2023 and a provision for credit losses of $1.0 million for the year ended December 31, 2023. The recovery was the result of improvements in the economic, credit quality and collateral dependent qualitative factors across several segments of the loan portfolio. In fourth quarter 2022, there was a provision for credit losses of $716,000 and a total provision of $866,000 for 2022. The ACL was $8.3 million at December 31, 2023, up $385,000 from December 31, 2022. The ACL as a percentage of total loans was 1.01% at December 31, 2023, compared to 1.07% at December 31, 2022. The reserve for unfunded commitments was $690,000 at December 31, 2023.
DIVIDEND DECLARATION
On January 18, 2024, our Board of Directors declared a fourth quarter dividend of $0.26 per share to common shareholders. Based on our most recent trade price of $18.99 per share, this constitutes a 5.48% yield on an annualized basis. The dividend will be paid on February 29, 2024, to shareholders of record as of February 14, 2024.
###
ABOUT US
F&M Bank Corp. is an independent, locally owned, financial holding company, offering a full range of financial services through our subsidiary, Farmers & Merchants Bank’s (F&M Bank) fourteen banking offices in Rockingham, Shenandoah, and Augusta counties, Virginia, and the cities of Winchester and Waynesboro, Virginia. The Company also owns F&M Mortgage, a mortgage lending subsidiary, and VSTitle, a title company subsidiary. Founded in 1908 as a community venture to serve the farmers and merchants of the Shenandoah Valley, where both the Company and the Bank are headquartered, F&M Bank remains more committed than ever to the success of the agricultural industry, small business ventures, and the nonprofit sector. The only publicly traded organization based in Rockingham County, the Company’s core values of enthusiasm, flexibility, responsiveness, community, and fun drive its corporate philanthropy, volunteerism, and local decision-making. With a strong suite of financial products and services, philanthropic efforts, and a team dedicated to serving, our responsibility is to provide a bright future right here where we all live, work, and play. Additional information may be found by visiting our website, fmbankva.com.
NON-GAAP FINANCIAL MEASURES
The accounting and reporting policies of the Company conform to U.S. generally accepted accounting principles (“GAAP”) and prevailing practices in the banking industry. However, management uses certain non-GAAP measures, including tangible common equity and tangible book value per share, to supplement the evaluation of the Company’s financial condition and performance. Management believes presentation of these non-GAAP financial measures provides useful supplemental information that is essential to a proper understanding of the Company’s operating results. These non-GAAP disclosures should not be viewed as a substitute for operating results determined in accordance with GAAP, nor are they necessarily comparable to non-GAAP performance measures that may be presented by other companies. A definition of GAAP to non-GAAP measures is included in the footnotes to table accompanying this release.
FORWARD-LOOKING STATEMENTS
This press release may contain “forward-looking statements” as defined by federal securities laws, which are subject to significant risks and uncertainties. These include statements regarding future plans, strategies, results, or expectations that are not historical facts, and are generally identified by the use of words such as “believe,” “expect,” “intend,” “anticipate,” “will,” “estimate,” “project” or similar expressions. These statements are based on estimates and assumptions, and our ability to predict results, or the actual effect of future plans or strategies, is inherently uncertain. Our actual results could differ materially from those contemplated by these forward-looking statements. Factors that could have a material adverse effect on our operations and future prospects include, but are not limited to, changes in local and national economies or market conditions; changes in interest rates; regulations and accounting principles; changes in policies or guidelines; loan demand and asset quality, including values of real estate and other collateral; deposit flow; the impact of competition from traditional or new sources; and the other factors detailed in our Securities and Exchange Commission filings, including our Annual Report on Form 10-K for the year ended December 31, 2022. Readers should consider these risks and uncertainties in evaluating forward-looking statements and should not place undue reliance on such statements. We undertake no obligation to update these statements following the date of this press release.
FOR MORE INFORMATION, CONTACT
Lisa F. Campbell | EVP | Chief Financial Officer
540-896-1705
fmbankva.com
F&M Bank Corp.
Summary Consolidated Financial Data (unaudited)
Dollars in Thousands, except for per share data
Quarter to Date
Year-to-Date
12/31/2023
9/30/2023(3)
6/30/2023
3/31/2023
12/31/2022(3)
9/30/2022(3)
6/30/2022(3)
3/31/2022(3)
12/31/2023
12/31/2022(3)
Condensed Balance Sheet
Cash and cash equivalents
$23,717
$22,159
$36,505
$31,273
$34,953
$30,312
$17,254
$48,376
$23,717
$34,953
Investment securities
379,557
383,502
394,868
398,960
403,537
440,294
456,636
471,089
379,557
403,537
Loans held for sale
1,119
2,028
881
1,242
1,373
3,310
5,449
2,479
1,119
1,373
Gross loans
822,092
805,602
776,260
756,920
743,604
699,592
690,497
659,560
822,092
743,604
Allowance for credit losses
(8,321)
(9,166)
(8,769)
(8,546)
(7,936)
(7,513)
(7,798)
(7,389)
(8,321)
(7,936)
Goodwill
3,082
3,082
3,082
3,082
3,082
3,082
3,082
3,082
3,082
3,082
Other assets
73,350
75,212
75,543
69,944
67,289
67,572
66,432
61,062
73,350
67,289
Total Assets
$1,294,596
$1,282,419
$1,278,370
$1,252,875
$1,245,902
$1,236,649
$1,231,552
$1,238,259
$1,294,596
$1,245,902
Noninterest bearing deposits
$264,254
$277,219
$277,578
$284,060
$293,596
$300,394
$291,728
$298,676
$264,254
$293,596
Interest bearing deposits
868,982
856,691
859,534
821,175
789,781
817,000
808,482
813,619
868,982
789,781
Total Deposits
1,133,236
1,133,910
1,137,112
1,105,235
1,083,377
1,117,394
1,100,210
1,112,295
1,133,236
1,083,377
Short-term debt
60,000
60,000
47,000
55,000
70,000
30,000
30,000
–
60,000
70,000
Long-term debt
6,932
6,922
6,911
6,901
6,890
6,879
11,788
21,780
6,932
6,890
Other liabilities
16,105
14,567
15,153
13,104
14,843
16,699
17,604
16,199
16,105
14,843
Total Liabilities
1,216,273
1,215,399
1,206,176
1,180,240
1,175,110
1,170,972
1,159,602
1,150,274
1,216,273
1,175,110
Shareholders’ equity
78,323
67,020
72,194
72,635
70,792
65,677
71,950
87,985
78,323
70,792
Total Liabilities and Shareholders’ Equity
$1,294,596
$1,282,419
$1,278,370
$1,252,875
$1,245,902
$1,236,649
$1,231,552
$1,238,259
$1,294,596
$1,245,902
Condensed Income Statement
Interest income and fees on loans
$13,061
$12,525
$11,517
$10,854
$9,884
$8,881
$7,993
$7,510
$47,957
$34,268
Interest income and fees on loans held for sale
22
19
25
22
16
29
32
29
88
106
Income on cash and securities
2,074
2,028
2,082
2,097
2,157
2,102
1,984
1,522
8,281
7,765
Total Interest Income
15,157
14,572
13,624
12,973
12,057
11,012
10,009
9,061
56,326
42,139
Interest expense on deposits
6,108
5,811
5,216
4,042
2,675
1,378
837
845
21,177
5,735
Interest expense on short-term debt
812
702
523
992
556
158
46
–
3,029
760
Interest expense on long-term debt
116
115
116
112
122
345
124
159
459
750
Total Interest Expense
7,036
6,628
5,855
5,146
3,353
1,881
1,007
1,004
24,665
7,245
Net Interest Income
8,121
7,944
7,769
7,827
8,704
9,131
9,002
8,057
31,661
34,894
Provision for (recovery of) credit losses
(134)
620
539
–
716
–
600
(450)
1,025
866
Noninterest Income
2,464
2,572
2,752
2,366
3,450
2,282
3,077
2,483
10,154
11,292
Noninterest Expense
10,482
8,922
10,172
9,189
9,541
8,872
9,559
8,550
38,765
36,522
Income tax expense (benefit)
(220)
(44)
(431)
(51)
200
237
131
(88)
(746)
480
Net Income
$457
$1,018
$241
$1,055
$1,697
$2,304
$1,789
$2,528
$2,771
$8,318
Per Share Data
Earnings per common share – basic
$0.13
$0.29
$0.07
$0.30
$0.49
$0.67
$0.51
$0.74
$0.79
$2.41
Book Value per Share
22.47
19.43
20.75
20.86
20.48
19.02
21.01
29.42
22.47
20.48
Tangible Book Value per Share (1)
21.55
18.50
19.82
19.93
19.55
18.08
20.06
28.47
21.55
19.55
Key Performance Ratios
Return on Average Assets
0.14%
0.32%
0.08%
0.34%
0.54%
0.74%
0.58%
0.83%
0.22%
0.67%
Return on Average Equity
2.49%
5.80%
1.33%
5.97%
9.87%
13.28%
8.97%
12.91%
3.72%
8.53%
Noninterest Income / Average Assets
0.76%
0.80%
0.87%
0.77%
1.10%
0.73%
1.00%
0.81%
0.80%
0.92%
Noninterest Expense / Average Assets
3.23%
2.76%
3.22%
2.98%
3.05%
2.85%
3.10%
2.79%
3.05%
2.96%
Efficiency Ratio (2)
97.28%
82.60%
94.56%
88.10%
83.11%
75.62%
76.09%
78.68%
90.66%
78.30%
Net Interest Margin
2.66%
2.67%
2.66%
2.76%
3.04%
3.11%
3.13%
2.82%
2.67%
3.03%
Earning Asset Yield
4.96%
4.87%
4.65%
4.57%
4.21%
3.75%
3.48%
3.17%
4.74%
3.48%
Cost of Interest Bearing Liabilities
3.00%
2.87%
2.61%
2.40%
1.54%
0.87%
0.48%
0.49%
2.73%
0.62%
Cost of Funds
2.37%
2.26%
2.04%
1.83%
1.18%
0.66%
0.36%
0.38%
2.33%
0.49%
Net Interest Spread
1.96%
2.00%
2.04%
2.17%
2.67%
2.88%
3.00%
2.68%
2.01%
2.86%
Net Charge-offs
$770
$193
$344
$166
$293
$285
$192
$(92)
$1,473
$678
Net Charge-offs as a % of Avg Loans
0.38%
0.10%
0.18%
0.09%
0.16%
0.16%
0.12%
-0.06%
0.19%
0.10%
Non-Performing Loans
$6,469
$3,586
$1,997
$1,782
$2,262
$2,408
$1,906
$4,799
$6,469
$2,262
Non-Performing Loans to Total Assets
0.50%
0.28%
0.16%
0.14%
0.18%
0.19%
0.15%
0.39%
0.50%
0.18%
Non-Performing Assets
$6,524
$3,586
$1,997
$1,782
$2,262
$2,408
$2,103
$4,799
$6,524
$2,262
Non-Performing Assets to Total Assets
0.50%
0.28%
0.16%
0.14%
0.18%
0.19%
0.17%
0.39%
0.50%
0.18%
ACL/ALLL as a % of Total Loans
1.01%
1.14%
1.13%
1.13%
1.07%
1.07%
1.13%
1.12%
1.01%
1.07%
Loans to Deposits
72.54%
71.05%
68.27%
68.48%
68.64%
62.61%
62.76%
59.30%
72.54%
68.64%
(1) Tangible book value per share is calculated by subtracting goodwill and other intangibles from total shareholders’ equity and dividing the result by the common shares outstanding. Tangible book value per share is a non-GAAP financial measure that management believes provides investors with important information that may be related to the valuation of common stock.
(2) The Efficiency Ratio equals noninterest expenses divided by the sum of tax equivalent net interest income and noninterest income. Noninterest income excludes gains (losses) on securities transactions and low-income housing partnership losses. Noninterest expense excludes amortization of intangibles.
(3) Certain reclassifications have been made in the 2022 financial information to conform to reporting for the 2023. These reclassifications are not considered material and had no impact on prior year’s net income, balance sheet or shareholders’ equity.
F&M Bank is excited to partner again with the Virginia Bankers Association Education Foundation (VBA) to offer your seniors a unique scholarship opportunity on March 19, 2024 called Bank Day.
What is Bank Day?
The third Tuesday in March was declared Bank Day by the Virginia General Assembly in 1991. Through this program, high school seniors learn about banking, financial services, career opportunities within the banking industry, and the vital role banks play in their communities. From their experience, the students are required to write essays on their experiences. Thirteen scholarships will be awarded based on the essays.
Students will have access to a VBA-created Bank Day resource webpage during the month of March. This resource page will house relevant information that students will need to research to complete their essays for a chance to win college scholarships. F&M Bank will also be hosting students in-person, 9:00am-1:00pm on Tuesday, March 19, for an opportunity to learn more about our bank, the banking industry in Virginia, how we support our community, and financial career opportunities. More information about this gathering will be shared with students upon registration.
How much scholarship money is available?
A total of $26,000 will be awarded to twelve students across the Commonwealth.
Six honorable mention winners, each winning a $1,000 scholarship.
Six regional winners, each winning a $2,500 scholarship.
One of the regional winners will also be named the statewide winner, earning an extra $5,000 scholarship for a total of $7,500 in college scholarships!
Contact marketing@fmbankva.com for more information!
https://www.fmbankva.com/wp-content/uploads/2024/01/VBA-Bank-Day-2023-Participants.jpg808960Jacob Mowry/wp-content/themes/fmbank-enfold-child/images/FandMBank_whitelogo.svgJacob Mowry2024-01-16 13:46:572024-01-24 15:18:09F&M Bank to Host VBA Bank Day Student Scholarship Program in March
F&M Bank Corp. Reports Year-to-Date and Third Quarter 2023 Results and Quarterly Dividend Press Release | 11/01/2023
F&M Bank grows loans and net income in the third quarter, focuses on future growth and opportunities
See associated, unaudited consolidated financial data for additional information
TIMBERVILLE, VA / ACCESSWIRE / November 1, 2023 / F&M Bank Corp. (the “Company” or “F&M”), (OTCQX:FMBM), the parent company of Farmers & Merchants Bank (“F&M Bank” or the “Bank”) today reported results for the third quarter and nine-month period ended September 30, 2023.
Net income was $1.0 million or $0.29 per share for the quarter ended September 30, 2023, compared to $241,000 or $0.07 per share for the linked quarter ended June 30, 2023, and compared to $2.3 million or $0.67 per share for the prior year quarter ended September 30, 2022. For the nine months ended September 30, 2023, net income was $2.3 million, which includes $810,000 in after-tax, one-time expenses, including severance accruals for former bank officers. By comparison, the Company earned $6.6 million for the same period in 2022.
At September 30, 2023, the Company had total assets of $1.28 billion, total loans of $805.6 million, and total deposits of $1.13 billion. This reflects growth of $62.0 million in total loans and $50.5 million in total deposits since the end of 2022. Our loan portfolio consists of a solid mix of loan types, which we believe provides a hedge against risks associated with a concentration in any particular type of loan.
Commenting on these results, CEO Mike Wilkerson said, “Our goal is to remain the bank for the Shenandoah Valley. Our focus is on earning and keeping customer relationships, growing core deposits through these relationships, and extending fairly priced loans that help our customers and the Valley grow and remain strong. Deposit growth is a critical aspect of lending. Deposits entrusted to us are reinvested right here through loans that meet the needs of individuals and businesses who are strengthening our communities and providing jobs to our citizens. Due to the current interest rate environment, these new loans and those with adjustable interest rates are intended to reposition our loan portfolio to one that produces a higher yield.
“From an economic standpoint, 2023 continues to challenge everyone. In spite of that, we believe F&M’s balance sheet is strong, our loan portfolio is diverse and sound, our deposit base is balanced, and we have ample liquidity. These are all key indicators of a strong bank. Our leadership team is pleased with the Bank’s growth in both deposits and loans, while maintaining pricing discipline and asset quality. We continuously assess all of our business lines and make strategic adjustments intended to optimize capital, liquidity, and assets to provide future earnings, with safety and soundness as our foundation.
“Our team members, who are all invested in the health and well-being of their families, friends, and neighbors in the Shenandoah Valley, provide great customer service, and serve our communities with their time, talents, and energy. They understand the meaning and the importance of the words ‘community bank.'”
THIRD QUARTER INCOME STATEMENT REVIEW
Overview
Net income for third quarter of 2023 was $1.0 million or $0.29 per share, compared to $241,000 or $0.07 per share for the second quarter 2023, and $2.3 million or $0.67 per share for third quarter 2022. Interest income for the three months ended September 30, 2023, was $14.6 million, an increase of $993,000 over second quarter 2023 and $3.6 million over the prior year third quarter, due to higher loan volume and higher interest rates. Higher rates on interest bearing deposits, specifically money market accounts and time deposits, coupled with interest paid on short-term borrowings, increased the Bank’s interest expense to $6.6 million for third quarter 2023, up $773,000 from second quarter 2023 and up $4.7 million over third quarter 2022.
During third quarter 2023, the Bank recorded a $620,000 provision for credit losses due to loan growth of $29.3 million and $193,000 in net charge-offs compared to a provision of $539,000 in second quarter 2023, and no provision for credit losses in third quarter 2022. At September 30, 2023, the Allowance for Credit Losses (ACL) totaled $9.2 million or 1.14% of gross loans outstanding.
Net Interest Income
For third quarter 2023, net interest income totaled $8.0 million, an increase of $220,000 from second quarter 2023, as a $993,000 increase in interest income outpaced a $773,000 increase in interest expense. Interest income benefited from higher average loan balances and higher loan yields from new originations and adjustable-rate loans. The increase in interest expense is due to higher average balances and interest rates on interest-bearing deposits and short-term debt. The Bank’s net interest margin increased by one basis point to 2.67% on a linked quarter basis.
Compared to third quarter 2022, net interest income declined by $1.1 million, and our net interest margin decreased by 41 basis points. Interest income and fees on loans were $3.6 million higher than the same quarter last year due to higher rates on adjustable-rate loans and the $106.0 million in loan growth since September 30, 2022. Interest expense grew by $4.7 million from the same quarter last year due to higher interest rates on deposits and rates paid on short term FHLB advances, as well as higher average balances on interest-bearing deposits and short-term debt. Since last September, we have seen a shift from noninterest bearing demand deposits to interest-bearing deposits with noninterest bearing deposits declining by $23.2 million and interest-bearing deposits increasing by $39.7 million.
Noninterest Income
Noninterest income totaled $2.5 million for third quarter 2023, which was a decrease of $225,000 from second quarter 2023. Last quarter, income from Bank Owned Life Insurance (BOLI) was $441,000 higher than normal due to gains. In third quarter 2023, BOLI income was $181,000, which represents a return to a more normal pace as compared to the second quarter. Increases in title insurance income of $67,000 and other operating income of $154,000 partially offset the decline in BOLI income.
Noninterest income increased $245,000 from the third quarter of 2022. Investment services and insurance income increased by $58,000, title insurance income increased by $68,000, ATM and check card fees were up $44,000 and other operating income was up $201,000, which offset a decline in mortgage banking income of $130,000.
Noninterest Expenses
Noninterest expenses totaled $8.9 million in third quarter 2023, compared to $10.2 million in second quarter, a decrease of $1.3 million led by a decrease of $809,000 in salary expense. In the second quarter, the Bank accrued a potential one-time severance payment to a former officer in the amount of $764,000. Without that accrual, salary expense would have been $4.3 million. Also contributing to the decrease in noninterest expenses is a decrease in employee benefits expense of $187,000, a decrease in equipment expense of $99,000, a decrease in legal and professional fees expense of $212,000, and a decrease in telecommunications and data processing expense of $117,000. There were some categories that increased over the prior quarter. Other operating expenses were up $41,000, ATM and check card expense was up $73,000, occupancy expense was up $54,000 and FDIC insurance expense was up $50,000.
Compared to the same quarter in 2022, noninterest expenses increased $50,000. The following noninterest expense categories were higher in the third quarter of 2023: occupancy expense was up $29,000; marketing expense was $66,000 higher; legal and professional fees were $32,000 higher, equipment expense was $63,000 higher, FDIC insurance expense was up $10,000, ATM and check card fees were up $28,000 and other operating expenses were up $352,000. These increases were offset by decreases in salary expense of $124,000, employee benefits expense of $277,000, OREO expense of $59,000 and telecommunications expenses of $68,000.
YEAR-TO-DATE INCOME STATEMENT REVIEW
Overview
Net income for the nine months ended September 30, 2023, was $2.3 million or $0.66 per share, compared to $6.6 million or $1.92 per share for the same period in 2022. During this period of 2023, there were severance accruals for two former bank officers which contributed $810,000 in after-tax, one-time expenses. Interest income for the first nine months of 2023 was $41.2 million, an increase of $11.1 million over the first nine months of 2022, due to growth in the loan portfolio and higher interest rates. Higher rates on interest bearing deposits, specifically money market accounts and time deposits, coupled with interest paid on short-term borrowings, increased the Bank’s interest expense to $17.6 million, up $13.7 million from the nine months ended September 30, 2022.
During the first nine months of 2023, the Bank recorded a $1.2 million provision for credit losses compared to $150,000 for the same period in 2022. A provision is a reserve for expected potential future credit losses.
Net Interest Income
Since September 30, 2022, short term interest rates have risen significantly due to six Federal Reserve interest rate hikes totaling 225 basis points. This has directly impacted the Bank’s costs for deposits and short-term borrowings, while the longer-term rates used to price loans have not increased to the same extent. In the first nine months of 2023, net interest income totaled $23.6 million, a decrease of $2.6 million from the first nine months of 2022, as an $11.1 million increase in interest income was outpaced by a $13.7 million increase in interest expense. Comparing the two periods, higher loan interest income boosted the earning asset yield by 120 basis points to 4.68% meanwhile the cost of funds increased by 155 basis points, resulting in a decrease in net interest margin of 35 basis points to 2.68%.
Noninterest Income
Noninterest income, including net losses on the sale of securities, totaled $7.6 million for the nine months ended September 30, 2023, which was a decrease of $294,000 from the same period in 2022. The primary reasons for this decrease were reductions of $81,000 in service charges on deposit accounts, $1.0 million in mortgage banking income and $146,000 in title insurance income. The declines in mortgage banking and title insurance income are due to the overall decrease in mortgage banking volume and a shift from loans being sold on the secondary market to portfolio adjustable-rate mortgages (ARMs) and construction products. These decreases were partially offset by a $460,000 increase in income from BOLI, an increase of $216,000 in investment services and insurance income, higher ATM and check card fees which grew by $148,000, and a $140,000 increase in other operating income. In the first nine months of 2022, there was a $97,000 loss on the sale of investment securities compared to no loss in the same period in 2023.
Noninterest Expenses
Noninterest expenses totaled $28.3 million in the first nine months of 2023, compared to $27.0 million in the same period of 2022, an increase of $1.3 million. A primary driver for this increase were the $1.0 million in severance accruals recorded in the first and second quarters of 2023. These accruals contributed to an $881,000 increase in salary expense to $13.6 million. Other year-over-year increases include higher equipment expense which increased $220,000, marketing expenses which were up $154,000, legal and professional fees which were $290,000 higher than last year and higher other operating expenses, up $751,000. These higher expenses were partially offset by decreases in employee benefits expense and telecommunications and data processing expenses which were down $668,000 and $279,000, respectively.
BALANCE SHEET REVIEW
On September 30, 2023, assets totaled $1.28 billion, an increase of $36.5 million over December 31, 2022. Total loans increased by $62.0 million to $805.6 million, including increases of $29.0 million in 1-to-4 family adjustable-rate mortgage loans, $15.6 million in dealer financing loans, $7.7 million in owner-occupied commercial real estate loans, and $6.7 million in agricultural loans. Investment securities decreased by $20.0 million due to paydowns on U.S. Agency mortgage-backed securities and expected bond maturities and an increase in the unrealized loss on the bond portfolio. During most of 2023, the unrealized loss had been improving but a recent increase in interest rates reversed that trend and the loss widened to $54.5 million at September 30, 2023, from $51.2 million at December 31, 2022. The Bank expects to receive cashflows totaling $113.1 million from bond paydowns and maturities by the end of 2024.
Total deposits on September 30, 2023, were $1.13 billion, an increase of $50.5 million from the end of 2022, as the Bank was able to attract deposits by offering higher rates on money market and time deposit accounts and opening insured cash sweep accounts for new and existing customers. The additional deposits allowed us to reduce Federal Home Loan Bank (FHLB) advances by $10.0 million. At September 30, 2023, 12.32% of the Bank’s total deposits were uninsured.
Shareholders’ equity decreased by $3.8 million to $67.0 million due to an increase of $2.6 million in accumulated other comprehensive loss associated with the unrealized loss on available for sale investment securities, and the $1.2 million adjustment to retained earnings upon the adoption of the Current Expected Credit Loss (CECL) accounting standard on January 1, 2023. These decreases were partially offset by year-to-date net income of $2.3 million. Tangible book value per common share has declined to $18.501 from $19.551 at December 31, 2022.
LIQUIDITY
The Company’s on-balance sheet asset liquidity includes cash and cash equivalents, unpledged investment securities and loans held for sale, which totaled $206.4 million at September 30, 2023, down from $439.9 million at December 31, 2022. The Bank has pledged investment securities with a par value as of September 30, 2023, totaling $222.5 million to the Federal Reserve System’s Bank Term Funding Program (BTFP). In March 2023, the Board of Governors of the Federal Reserve System established the BTFP to provide any U.S. federally insured depository institution, including the Bank, with a line of credit equal to the par value of securities pledged to the BTFP. Advances from the BTFP may be requested by the Bank for up to one year until March 31, 2024. The Bank has not borrowed from the BTFP during 2023.
1 Tangible book value per common share is a non-GAAP financial measure. Further information can be found under the heading “Non-GAAP Financial Measures” and in the reconciliation table accompanying this release.
In addition to the BTFP, the Bank has access to off-balance sheet liquidity through unsecured Federal funds lines totaling $90.0 million at September 30, 2023, and December 31, 2022. The Bank also has a secured line of credit with the FHLB with available credit of $95.9 million and $39.1 million as of September 30, 2023, and December 31, 2022, respectively. The FHLB line of credit is secured by a blanket lien on qualifying loans in the residential, commercial, agricultural real estate, and home equity portfolios.
The Bank is scheduled to receive $113.1 million from bond paydowns and maturities by the end of 2024 which can be used to fund future loan growth and for other purposes.
LOAN PORTFOLIO
The Company’s loan portfolio is diversified with its two largest segments being residential mortgage loans originated through its subsidiary F&M Mortgage, and automobile loans originated by its dealer finance division.
Loan Category
Balance as of September 30, 2023 (in thousands)
Percentage of Total Portfolio
Residential mortgage loans
$187,868
23.32%
Automobile loans
123,981
15.39%
Non owner occupied commercial real estate
102,216
12.69%
Owner occupied commercial real estate
91,836
11.40%
Secured by farmland
80,502
9.99%
Commercial and industrial (includes Agriculture Loans)
60,581
7.52%
Home equity lines of credit
46,351
5.75%
Other construction and land development loans
46,027
5.71%
Residential construction loans
34,320
4.26%
Credit card and other consumer loans
17,958
2.23%
Multifamily
8,257
1.03%
Other loans
5,705
0.71%
Total
$805,602
100%
ASSET QUALITY AND ALLOWANCE FOR CREDIT LOSSES
Nonperforming loans (NPLs) as a percentage of total assets were 0.28% at September 30, 2023, compared to 0.18% at December 31, 2022, and 0.19% at September 30, 2022. Net charge-offs as a percentage of average loans were 0.10% for the quarter ended September 30, 2023, down from 0.16% for third quarter 2022. For the nine months ended September 30, 2023, the net charge off percentage was 0.12%, up slightly from 0.08% in the similar period in 2022.
Provision for credit losses was $620,000 for third quarter and $1.2 million for the nine-month period ended September 30, 2023. The provision for credit losses for the quarter was due to loan growth of $29.3 million and $193,000 in net charge-offs. In the third quarter of 2022, there was no provision for credit losses. The ACL was $9.2 million at September 30, 2023, up $1.2 million from December 31, 2022. The ACL as a percentage of total loans was 1.14% at September 30, 2023, compared to 1.07% at December 31, 2022. The reserve for unfunded commitments was $749,000 at September 30, 2023.
DIVIDEND DECLARATION
On October 19, 2023, our Board of Directors declared a third quarter dividend of $0.26 per share to common shareholders. Based on our most recent trade price of $17.24 per share, this constitutes a 6.03% yield on an annualized basis. The dividend will be paid on November 29, 2023, to shareholders of record as of November 14, 2023.
###
ABOUT US
F&M Bank Corp. is an independent, locally owned, financial holding company, offering a full range of financial services through our subsidiary, Farmers & Merchants Bank’s (F&M Bank) thirteen banking offices in Rockingham, Shenandoah, and Augusta counties, Virginia, and the city of Winchester, Virginia. The Company also holds F&M Mortgage, a mortgage lending subsidiary, and VSTitle, our title company subsidiary. Founded in 1908 as a community venture to serve the farmers and merchants of the Shenandoah Valley, where both the Company and the Bank are headquartered, F&M Bank remains more committed than ever to the success of the agricultural industry, small business ventures, and the nonprofit sector. The only publicly traded organization based in Rockingham County, the Company’s core values of enthusiasm, flexibility, responsiveness, community, and fun drive its corporate philanthropy, volunteerism, and local decision-making. With a strong suite of financial products and services, philanthropic efforts, and a team dedicated to serving, our responsibility is to provide a bright future right here where we all live, work, and play. Additional information may be found by visiting our website, fmbankva.com.
NON-GAAP FINANCIAL MEASURES
The accounting and reporting policies of the Company conform to U.S. generally accepted accounting principles (“GAAP”) and prevailing practices in the banking industry. However, management uses certain non-GAAP measures, including tangible common equity and tangible book value per share, to supplement the evaluation of the Company’s financial condition and performance. Management believes presentation of these non-GAAP financial measures provides useful supplemental information that is essential to a proper understanding of the Company’s operating results. These non-GAAP disclosures should not be viewed as a substitute for operating results determined in accordance with GAAP, nor are they necessarily comparable to non-GAAP performance measures that may be presented by other companies. A reconciliation of GAAP to non-GAAP measures is included in the tables accompanying this release.
FORWARD-LOOKING STATEMENTS
This press release may contain “forward-looking statements” as defined by federal securities laws, which are subject to significant risks and uncertainties. These include statements regarding future plans, strategies, results, or expectations that are not historical facts, and are generally identified by the use of words such as “believe,” “expect,” “intend,” “anticipate,” “will,” “estimate,” “project” or similar expressions. These statements are based on estimates and assumptions, and our ability to predict results, or the actual effect of future plans or strategies, is inherently uncertain. Our actual results could differ materially from those contemplated by these forward-looking statements. Factors that could have a material adverse effect on our operations and future prospects include, but are not limited to, changes in local and national economies, or market conditions; changes in interest rates; regulations and accounting principles; changes in policies or guidelines; loan demand and asset quality, including values of real estate and other collateral; deposit flow; the impact of competition from traditional or new sources; and the other factors detailed in our Securities and Exchange Commission filings, including our Annual Report on Form 10-K for the year ended December 31, 2022. Readers should consider these risks and uncertainties in evaluating forward-looking statements and should not place undue reliance on such statements. We undertake no obligation to update these statements following the date of this press release.
F&M Bank Corp. Summary Consolidated Financial Data (unaudited) Dollars in Thousands, except for per share data
Quarter to Date
Year-to-Date
9/30/2023
6/30/2023 (3)
3/31/2023 (3)
12/31/2022 (3)
9/30/2022 (3)
9/30/2023
9/30/2022 (3)
Condensed Balance Sheet
Cash and cash equivalents
$
22,159
$
36,505
$
31,273
$
34,953
$
30,312
$
22,159
$
30,312
Investment securities
383,502
394,868
398,960
403,537
440,294
383,502
440,294
Loans held for sale
2,028
881
1,242
1,373
3,310
2,028
3,310
Gross loans
805,602
776,260
756,920
743,604
699,592
805,602
699,592
Allowance for credit losses
(9,166
)
(8,769
)
(8,546
)
(7,936
)
(7,513
)
(9,166
)
(7,513
)
Goodwill
3,082
3,082
3,082
3,082
3,082
3,082
3,082
Other assets
75,212
75,543
69,944
67,289
67,572
75,212
67,572
Total Assets
$
1,282,419
$
1,278,370
$
1,252,875
$
1,245,902
$
1,236,649
$
1,282,419
$
1,236,649
Noninterest bearing deposits
$
277,219
$
277,578
$
284,060
$
293,596
$
300,394
$
277,219
$
300,394
Interest bearing deposits
856,691
859,534
821,175
789,781
817,000
856,691
817,000
Total Deposits
1,133,910
1,137,112
1,105,235
1,083,377
1,117,394
1,133,910
1,117,394
Short-term debt
60,000
47,000
55,000
70,000
30,000
60,000
30,000
Long-term debt
6,922
6,911
6,901
6,890
6,879
6,922
6,879
Other liabilities
14,567
15,153
13,104
14,843
16,699
14,567
16,699
Total Liabilities
1,215,399
1,206,176
1,180,240
1,175,110
1,170,972
1,215,399
1,170,972
Shareholders’ equity
67,020
72,194
72,635
70,792
65,677
67,020
65,677
Total Liabilities and Shareholders’ Equity
$
1,282,419
$
1,278,370
$
1,252,875
$
1,245,902
$
1,236,649
$
1,282,419
$
1,236,649
Condensed Income Statement
Interest income and fees on loans
$
12,525
$
11,517
$
10,854
$
9,884
$
8,881
$
34,896
$
24,384
Interest income and fees on loans held for sale
19
25
22
16
29
66
90
Income on cash and securities
2,073
2,082
2,097
2,202
2,102
6,252
5,608
Total Interest Income
14,617
13,624
12,973
12,102
11,012
41,214
30,082
Interest expense on deposits
5,811
5,216
4,042
2,675
1,378
15,069
3,060
Interest expense on short-term debt
702
523
992
556
158
2,217
204
Interest expense on long-term debt
115
116
112
122
345
343
628
Total Interest Expense
6,628
5,855
5,146
3,353
1,881
17,629
3,892
Net Interest Income
7,989
7,769
7,827
8,749
9,131
23,585
26,190
Provision for credit losses
620
539
–
716
–
1,159
150
Noninterest Income
2,527
2,752
2,366
2,297
2,282
7,645
7,939
Noninterest Expense
8,922
10,172
9,189
9,463
8,872
28,283
26,981
Net gains (losses) on sale of securities
–
–
–
1,030
–
–
(97
)
Income tax expense (benefit)
(44
)
(431
)
(51
)
200
237
(526
)
280
Net Income
$
1,018
$
241
$
1,055
$
1,697
$
2,304
$
2,314
$
6,621
Per Share Data
Earnings per common share – basic
$
0.29
$
0.07
$
0.30
$
0.49
$
0.67
$
0.66
$
1.92
Book Value per Share
19.43
20.75
20.86
20.50
19.02
19.43
19.02
Tangible Book Value per Share (1)
18.50
19.82
19.93
19.55
18.08
18.50
18.08
Key Performance Ratios
Return on Average Assets
0.32
%
0.08
%
0.34
%
0.54
%
0.74
%
0.25
%
1.08
%
Return on Average Equity
5.58
%
1.33
%
5.97
%
9.86
%
13.28
%
4.33
%
13.68
%
Noninterest Income / Average Assets
0.80
%
0.88
%
0.77
%
0.73
%
0.73
%
0.81
%
1.30
%
Noninterest Expense / Average Assets
2.82
%
3.27
%
3.00
%
3.02
%
2.85
%
3.01
%
4.41
%
Efficiency Ratio (2)
83.16
%
94.56
%
88.10
%
83.89
%
73.87
%
88.54
%
76.73
%
Net Interest Margin
2.67
%
2.66
%
2.76
%
3.04
%
3.11
%
2.68
%
3.03
%
Earning Asset Yield
4.87
%
4.65
%
4.57
%
4.21
%
3.75
%
4.68
%
3.48
%
Cost of Interest Bearing Liabilities
2.87
%
2.61
%
2.40
%
1.54
%
0.87
%
2.63
%
0.62
%
Cost of Funds
2.26
%
2.04
%
1.83
%
1.20
%
0.66
%
2.04
%
0.49
%
Net Interest Spread
2.00
%
2.04
%
2.17
%
2.67
%
2.88
%
2.05
%
2.86
%
Net Charge-offs as a % of Avg Loans
0.10
%
0.27
%
0.09
%
0.16
%
0.16
%
0.12
%
0.08
%
Non-Performing Loans to Total Assets
0.28
%
0.16
%
0.14
%
0.18
%
0.19
%
0.28
%
0.19
%
Non-Performing Assets to Total Assets
0.28
%
0.16
%
0.14
%
0.18
%
0.19
%
0.28
%
0.19
%
ACL/ALLL as a % of Total Loans
1.14
%
1.13
%
1.13
%
1.07
%
1.07
%
1.14
%
1.07
%
Loans to Deposits
71.05
%
68.27
%
68.48
%
68.64
%
62.61
%
71.05
%
62.61
%
(1) Tangible book value per share is calculated by subtracting goodwill and other intangibles from total shareholders’ equity and dividing the result by the common shares outstanding. Tangible book value per share is a non-GAAP financial measure that management believes provides investors with important information that may be related to the valuation of common stock.
(2) The Efficiency Ratio equals noninterest expenses divided by the sum of tax equivalent net interest income and noninterest income. Noninterest income excludes gains (losses) on securities transactions and low-income housing partnership losses. Noninterest expense excludes amortization of intangibles.
(3) Certain reclassifications have been made in the prior period financial information to conform to reporting for the third quarter 2023. These reclassifications are not considered material and had no impact on prior year’s net income, balance sheet or shareholders’ equity.
FOR MORE INFORMATION, CONTACT
Lisa F. Campbell | EVP | Chief Financial Officer
540-896-1705 fmbankva.com
https://www.fmbankva.com/wp-content/uploads/2023/04/Coins.jpeg12412000Holly Thorne/wp-content/themes/fmbank-enfold-child/images/FandMBank_whitelogo.svgHolly Thorne2023-11-02 14:19:052023-12-13 14:59:00F&M Bank Corp. Reports Year-to-Date and Third Quarter 2023 Results and Quarterly Dividend
FOR IMMEDIATE RELEASE: Timberville, VA – F&M Bank Executive Vice President Takes the Helm as President of Virginia Mortgage Bankers Association – F&M Bank is excited to announce that Kevin Russell, Executive Vice President and President of F&M Mortgage, F&M Financial Services, and Title, has been appointed as the President of the Virginia Mortgage Bankers Association (VMBA) for the 2023-2024 year.
The VMBA is a prestigious trade association comprising mortgage bankers and affiliated industry associates. The association is dedicated to preserving and improving the mortgage lending system, advocating for the industry’s highest standards of ethics and professionalism.
Kevin Russell’s appointment as President of the VMBA is a testament to his exceptional leadership skills and extensive experience in the financial sector. With over 20 years of service in the industry, Kevin has consistently demonstrated his commitment to assisting individuals in achieving their dreams of homeownership.
A proud graduate of VA Tech and resident of Rockingham County, Kevin Russell understands the local market dynamics and the unique challenges faced by homebuyers in Virginia. His deep-rooted connections within the community and profound industry knowledge make him the perfect candidate to lead the VMBA and champion the interests of mortgage professionals across the state.
In his new role, Kevin Russell will leverage his expertise to drive innovation, foster collaboration, and advocate for policies that promote responsible lending practices and improve homeownership in Virginia. His unwavering dedication to ensuring a smooth, transparent mortgage lending process aligns perfectly with the VMBA’s mission.
“I am honored and excited to serve as President of the Virginia Mortgage Bankers Association,” said Kevin Russell. “I look forward to working closely with my fellow professionals to strengthen the mortgage lending industry in Virginia, promote statewide participation, and support initiatives that make homeownership more accessible to all.”
F&M Bank congratulates Kevin Russell on this well-deserved appointment and is confident that the VMBA will continue to flourish under his leadership and make significant contributions to the mortgage lending industry.
(Pictured from left to right: Jon Ischinger, Tina Lantz, Terri Bradley, Kevin Russell, Veronica Amato, and Tonja Showalter)
For more information, please contact:
Jake Mowry
VP, Marketing Manager
jmowry@fmbankva.com
About F&M Bank:
F&M Bank Corp. is an independent, locally owned, financial holding company, offering a full range of financial services through our subsidiary, Farmers & Merchants Bank’s (F&M Bank) thirteen banking offices in Rockingham, Shenandoah, and Augusta counties, Virginia, and the city of Winchester, Virginia. The Company also holds F&M Mortgage, a mortgage lending subsidiary, and VSTitle, our title company subsidiary. Founded in 1908 as a community venture to serve the farmers and merchants of the Shenandoah Valley, where both the Company and the Bank are headquartered, F&M Bank remains more committed than ever to the success of the agricultural industry, small business ventures, and the nonprofit sector. The only publicly traded organization based in Rockingham County, the Company’s core values of enthusiasm, flexibility, responsiveness, community, and fun drive its corporate philanthropy, volunteerism, and local decision-making. With a robust suite of financial products and services, philanthropic efforts, and a team dedicated to serving, our responsibility is to provide a bright future right here where we all live, work, and play. Additional information may be found by visiting our website, fmbankva.com.
###
https://www.fmbankva.com/wp-content/uploads/2023/09/KRussell-solo.jpg13332000Jacob Mowry/wp-content/themes/fmbank-enfold-child/images/FandMBank_whitelogo.svgJacob Mowry2023-09-25 16:18:282023-12-13 15:00:22F&M Bank Executive Vice President Takes the Helm as President of Virginia Mortgage Bankers Association